
Uncategorized files
Showing below up to 500 results in range #1 to #500.
View (previous 500 | next 500) (20 | 50 | 100 | 250 | 500)
 10Schools.png 431 × 450; 302 KB
 10Schools1.png 593 × 450; 265 KB
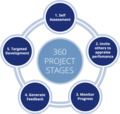 360-Project-Stages-300x285.png 300 × 285; 60 KB
 360-evaluation-sample.jpg 600 × 700; 223 KB
 360-evaluation-template.jpg 600 × 600; 287 KB
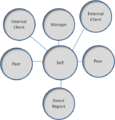 360 Degree Eval Diagram.png 544 × 569; 41 KB
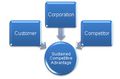 3C's Model.jpg 347 × 227; 8 KB
 4Ps of Strategy.jpg 364 × 280; 12 KB
 4SWMModel.jpg 680 × 510; 26 KB
 4orgculture.png 683 × 598; 183 KB
 5C Analysis.jpg 864 × 435; 46 KB
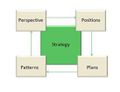
 5Ps Model.png 465 × 553; 62 KB
 5 I CPI Approach.png 1,900 × 1,079; 2.28 MB
 5 Steps of Planning.png 758 × 255; 56 KB
 5 teps of Planning.png 1,193 × 405; 13 KB
 6 thinking hats.png 1,024 × 313; 164 KB
 7-smodel1.png 442 × 195; 40 KB
 7-smodel2.png 420 × 198; 52 KB
 7-smodel3.png 448 × 141; 9 KB
 7-smodel4.png 361 × 396; 115 KB
 7-smodel5.png 474 × 686; 17 KB
 7Ps marketing.jpg 460 × 400; 39 KB
 7 Cs of Communication.png 2,121 × 1,866; 185 KB
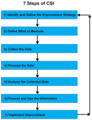 7 Steps of CSI.png 453 × 591; 133 KB
 8D-Problem-Solving-Diagram.jpg 283 × 387; 77 KB
 8 Hidden Needs.png 827 × 585; 162 KB
 8 Step Predictive Modeling.png 4,155 × 1,631; 2.48 MB
 8 attribute excellence.png 808 × 700; 851 KB
 ABAP.png 520 × 385; 24 KB
 ABAP1.jpg 505 × 240; 27 KB
 ABM.jpg 599 × 350; 19 KB
 ABM1.jpg 624 × 266; 55 KB
 ACO Operating.jpg 375 × 430; 38 KB
 ACO Traditional.png 487 × 500; 177 KB
 ADAS.png 1,290 × 508; 399 KB
 ADAS1.png 1,311 × 645; 305 KB
 ADAS2.png 1,033 × 664; 326 KB
 ADL.gif 611 × 298; 56 KB
 ADM.png 337 × 450; 200 KB
 ADM1.png 514 × 390; 281 KB
 ADMS.png 1,063 × 641; 519 KB
 ADT.jpg 1,077 × 524; 58 KB
 AFI2.jpg 715 × 450; 75 KB
 ALM.png 971 × 465; 60 KB
 AMI.png 521 × 368; 122 KB
 AMOLED.png 1,020 × 340; 198 KB
 AMPS.png 648 × 330; 60 KB
 ANSI.png 1,909 × 781; 119 KB
 APA Results.png 917 × 516; 239 KB
 APA Time.png 698 × 583; 202 KB
 APM-new-50.png 1,000 × 963; 637 KB
 APS.png 426 × 328; 56 KB
 APS1.png 872 × 602; 142 KB
 APS2.png 639 × 270; 72 KB
 ARAD.png 671 × 400; 188 KB
 ARM.png 560 × 377; 151 KB
 ARPANET.jpg 634 × 490; 90 KB
 ASCII.png 632 × 273; 11 KB
 ASCII2.png 635 × 268; 9 KB
 ASN.png 939 × 679; 206 KB
 ASN1 Types and Universal tags.png 1,255 × 1,287; 472 KB
 ASRM.png 608 × 615; 149 KB
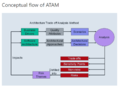
 ATAM.png 1,153 × 859; 251 KB
 ATAM1.png 1,025 × 752; 309 KB
 ATS.jpg 370 × 600; 40 KB
 Abandonment.png 817 × 585; 103 KB
 Abandonment1.jpg 914 × 585; 61 KB
 Abc analysis.png 900 × 643; 312 KB
 Abcanalysis.png 516 × 220; 64 KB
 Abcd.jpg 599 × 407; 36 KB
 Above the Fold.png 538 × 600; 239 KB
 Above the Fold1.jpg 849 × 450; 69 KB
 Abowd-beale.png 1,127 × 667; 179 KB
 Abowd-beale1.png 992 × 767; 72 KB
 AbsorptionCosting.gif 640 × 480; 11 KB
 Abstract class needs to be extended.png 1,362 × 150; 34 KB
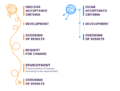 Acceptance Criteria.png 492 × 375; 55 KB
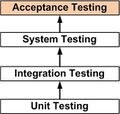 Acceptance Testing.jpg 285 × 270; 20 KB
 Acceptance Testing1.jpg 622 × 295; 33 KB
 Access Control List.jpg 310 × 247; 13 KB
 Access Control List1.png 361 × 600; 104 KB
 Access Control Using Serial Controllers.png 220 × 109; 15 KB
 Access Method.jpg 451 × 391; 42 KB
 Access Point.png 808 × 401; 252 KB
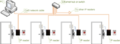
 Access control system using IP controllers.png 220 × 103; 17 KB
 Access control system using IP readers.png 220 × 81; 14 KB
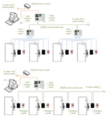 Access control system using network-enabled main controllers.png 220 × 240; 33 KB
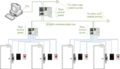 Access control system using serial main and sub-controllers.png 220 × 126; 20 KB
 Accounting-equation.jpg 577 × 295; 37 KB
 Accounts Receivable Turnover Ratio.png 782 × 87; 11 KB
 Acquisition.png 667 × 600; 195 KB
 Action Centred Leadership.jpg 571 × 332; 32 KB
 Action Priority Matrix.gif 312 × 288; 26 KB
 Action learning.jpg 253 × 218; 8 KB
 Action logic.jpg 425 × 215; 17 KB
 Action research.gif 425 × 387; 9 KB
 Active Data Dictionary.png 2,630 × 1,598; 563 KB
 Active Directory.jpg 959 × 719; 78 KB
 Active Directory1.gif 335 × 259; 18 KB
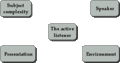 Active listening.gif 250 × 132; 4 KB
 Activity-Network-Diagram-Example-Chart.png 558 × 233; 26 KB
 Activity-based-costing.jpg 510 × 201; 58 KB
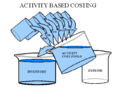 ActivityBasedCosting.gif 640 × 480; 11 KB
 ActivityDiagram.png 688 × 726; 114 KB
 ActivityDiagram1.gif 600 × 538; 42 KB
 Activity Diagram.png 735 × 730; 86 KB
 Actor Involvement.png 900 × 532; 30 KB
 Actor Power.png 900 × 532; 33 KB
 Actor map.png 800 × 442; 119 KB
 Ad Ops.gif 550 × 373; 46 KB
 Adapter.png 283 × 218; 24 KB
 AdaptiveWebDesign.png 840 × 435; 347 KB
 Adaptive Enterprise.jpg 473 × 2,700; 249 KB
 Adaptive Enterprise1.png 450 × 450; 40 KB
 Adaptive Enterprise Framewrk.jpg 359 × 375; 44 KB
 Adaptive Security Architecture1.png 380 × 298; 64 KB
 Adaptive Strategy.png 280 × 195; 16 KB
 Adaptive Strategy1.jpg 506 × 300; 37 KB
 Adaptive learning.jpg 640 × 477; 34 KB
 Additional Devices.png 1,024 × 163; 38 KB
 AdditiveManufacturimg.png 4,000 × 2,138; 552 KB
 Addressabletv.jpg 300 × 268; 32 KB
 Adl matrix.jpg 554 × 412; 66 KB
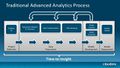 Advanced Analytics.jpg 638 × 359; 53 KB
 Advantages and Disadvantages of Matrix Management.png 400 × 234; 49 KB
 Advantages of Internal Control.jpg 494 × 479; 41 KB
 Advocacy Marketing.png 887 × 688; 104 KB
 Affective Computing.png 499 × 300; 140 KB
 Affinity wall.png 800 × 627; 144 KB
 Agenda-Setting Theory-1.png 392 × 222; 58 KB
 Aggregate+demand+AD.png 320 × 168; 35 KB
 Aggregate supply.png 647 × 525; 85 KB
 Agile Modeling.jpg 642 × 375; 47 KB
 Airline Example Business Agility.png 599 × 431; 83 KB
 Albers1.png 887 × 369; 88 KB
 AlogorithmicBusiness.png 1,001 × 585; 131 KB
 Analog Signal Processing.jpg 428 × 178; 17 KB
 Analyticalcrm.jpg 728 × 546; 120 KB
 Analyticalcrm1.png 1,369 × 767; 389 KB
 Analyzer Strategy.png 854 × 132; 20 KB
 Ansoff Matrix.png 1,578 × 1,473; 105 KB
 App-Modernization.jpg 800 × 392; 40 KB
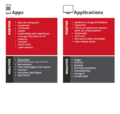 App Vs Application.png 630 × 600; 13 KB
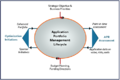 Application-Portfolio-Management-Lifecycle.png 475 × 317; 53 KB
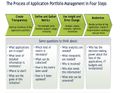 Application-Portfolio-Management-process.jpg 636 × 494; 80 KB
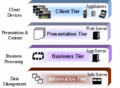
 Application Architecture 2 tier.png 397 × 128; 13 KB
 Application Architecture 3 tier.png 498 × 128; 18 KB
 Application Architecture 4 tier.png 534 × 128; 21 KB
 Application Architecture Client Server Pattern.png 397 × 128; 10 KB
 Application Architecture Distributed Deployment.png 418 × 140; 17 KB
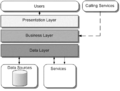 Application Architecture Layers.png 397 × 302; 13 KB
 Application Architecture Layers and Components.png 416 × 421; 31 KB
 Application Architecture Non-Distributed Deployment.png 326 × 140; 14 KB
 Application Integration.jpg 421 × 375; 42 KB
 Application Layer.png 1,837 × 1,223; 103 KB
 Application Layer Functions.jpg 444 × 264; 26 KB
 Application Management Services.png 1,192 × 396; 226 KB
 Application Modernization Value Curve.png 689 × 366; 111 KB
 Application Server.jpg 499 × 375; 26 KB
 Application Software.jpg 360 × 305; 49 KB
 Application of Business Value Model.png 597 × 480; 370 KB
 AppliedInformationEconomics1.png 512 × 499; 155 KB
 AppliedInformationEconomics2.png 451 × 450; 116 KB
 Appreciative Inquiry 4-D Model.jpg 508 × 315; 42 KB
 Architectural Pattern.gif 324 × 237; 17 KB
 Architectural Pattern1.png 1,350 × 364; 227 KB
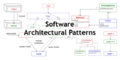 Architectural Pattern2.png 570 × 285; 55 KB
 Architectural Pattern3.png 858 × 480; 248 KB
 Architectural Principles.gif 262 × 192; 8 KB
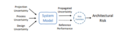 Architectural Risk.png 1,042 × 315; 142 KB
 Architectural style.png 958 × 756; 530 KB
 Architectural style1.png 956 × 291; 128 KB
 Architecturedrivenmodernization.png 647 × 507; 173 KB
 Arrow.jpg 55 × 70; 1 KB
 Artificial General Intelligence Strategies.png 975 × 260; 69 KB
 Artificial Intelligence.jpg 886 × 615; 75 KB
 Artificial Intelligence1.jpg 1,134 × 537; 101 KB
 Artificial Intelligence Applications.jpg 721 × 513; 74 KB
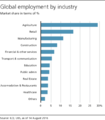 Artificial Intelligence Employment Impact.png 581 × 665; 65 KB
 Artificial Intelligence Progression.png 1,236 × 508; 152 KB
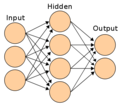 Artificial Neural Network.png 350 × 313; 34 KB
 Artificial Neural Network History.png 683 × 769; 94 KB
 Artificial Neural Networks in Business.jpg 1,387 × 555; 145 KB
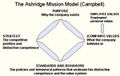 Ashridge Mission Model.jpg 399 × 252; 29 KB
 Ashridge Mission Model1.png 846 × 430; 489 KB
 Autonomous System.png 542 × 324; 74 KB
 Availability Management Principles.png 499 × 391; 57 KB
 Availability Plan Purpose.png 1,159 × 701; 447 KB
 Avoid Confirmation Bias.png 800 × 600; 88 KB
 BArchitecture.png 1,484 × 1,048; 209 KB
 BCG-growth-matrix.jpg 446 × 349; 21 KB
 BCP.png 606 × 495; 354 KB
 BCPlanning.png 963 × 98; 7 KB
 BCPlanning1.png 836 × 292; 248 KB
 BIA Process Activity.jpg 932 × 720; 83 KB
 BIA Risk Assessment Difference.png 997 × 733; 413 KB
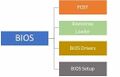 BIOS Functions.jpg 526 × 337; 14 KB
 BITS.jpg 528 × 444; 39 KB
 BI Model.png 1,322 × 686; 311 KB
 BMI.png 934 × 497; 782 KB
 BMIS.jpg 570 × 441; 32 KB
 BOA.png 902 × 463; 184 KB
 BPEng.png 290 × 420; 129 KB
 BPI.jpg 528 × 375; 32 KB
 BPM.png 405 × 369; 251 KB
 BPO Vs KPO.png 1,267 × 895; 347 KB
 Bachman Diagram.gif 970 × 482; 16 KB
 Backcasting.png 705 × 502; 118 KB
 Balanced-Scorecard-Graphic.jpg 4,782 × 3,576; 1.15 MB
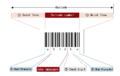 Barcode Components.png 804 × 510; 20 KB
 Bdd.jpg 260 × 231; 16 KB
 Behavioral-targeting-11-728.jpg 728 × 546; 82 KB
 Below the Fold.png 598 × 351; 124 KB
 Benefits Preferred by Men and Women.png 842 × 720; 128 KB
 Benefits Valued by Jobseekers.png 836 × 720; 123 KB
 Benefits of Effective Communication.png 3,632 × 1,393; 166 KB
 Benefits of IT Infrastructure.png 947 × 604; 173 KB
 Better Business Case.gif 687 × 273; 29 KB
 Better Business Case1.gif 633 × 351; 41 KB
 Big data imp.png 350 × 304; 45 KB
 Bimodal - Marathon Sprinter.jpg 636 × 326; 55 KB
 Bimodal - Mode 1 and Mode 2.png 770 × 720; 86 KB
 Bimodal IT Org Chart.png 1,600 × 810; 176 KB
 Bisociation.png 1,158 × 781; 135 KB
 Blockchain.png 1,342 × 705; 314 KB
 Blockchain1.png 1,308 × 296; 52 KB
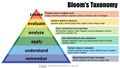 Blooms Taxonomy.jpg 650 × 366; 60 KB
 Bms.gif 430 × 233; 31 KB
 BoardOfDirectors.png 416 × 300; 138 KB
 Body.png 821 × 197; 25 KB
 Boolean Data Table.png 1,008 × 522; 168 KB
 Bottom Line.png 718 × 720; 154 KB
 Bottom of Pyramid.jpg 728 × 546; 51 KB
 Boundaryless Organization.png 960 × 239; 43 KB
 Bowtie Diagram.png 500 × 321; 117 KB
 Brainstorming Benefits.png 847 × 345; 79 KB
 Brand Ambassador.gif 638 × 382; 68 KB
 Brand Asset Valuator.png 660 × 430; 17 KB
 Brand Awareness.jpg 415 × 323; 28 KB
 Brand Equity.png 1,800 × 1,317; 98 KB
 Brand Identity.jpg 500 × 190; 18 KB
 Brand identity prism1.png 850 × 546; 210 KB
 Brand identity prism2.jpg 750 × 408; 105 KB
 Brand strategy.png 1,294 × 686; 496 KB
 Bridges Transition Model.png 1,118 × 687; 315 KB
 Bullwhipeffect1.png 868 × 755; 216 KB
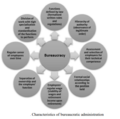 Bureaucracy.png 593 × 586; 177 KB
 Burke-Litwin Model.jpg 538 × 413; 52 KB
 Burkelitwinmodel.png 455 × 537; 63 KB
 Bus Topology.jpg 560 × 257; 22 KB
 Business-architecture-template.jpg 580 × 435; 67 KB
 Business-conceptual-model.jpg 960 × 720; 69 KB
 Business-transformation.jpg 728 × 546; 83 KB
 BusinessExcellence.png 917 × 505; 690 KB
 BusinessFunction.png 953 × 690; 717 KB
 BusinessFunction1.png 984 × 577; 199 KB
 BusinessFunction2.png 988 × 658; 179 KB
 BusinessITAlignment.png 298 × 285; 51 KB
 BusinessModelElements.png 485 × 622; 245 KB
 BusinessProcessArchitecture.png 740 × 538; 211 KB
 BusinessProcessArchitecture1.png 798 × 418; 118 KB
 Business Activity.jpg 332 × 103; 9 KB
 Business Agility.png 1,813 × 1,447; 829 KB
 Business Agility Domains.png 1,124 × 1,125; 631 KB
 Business Agility Value Stream.png 3,149 × 855; 542 KB
 Business Analysis Process.jpg 925 × 705; 93 KB
 Business Capability.png 1,018 × 163; 93 KB
 Business Capability1.png 672 × 498; 48 KB
 Business Capability2.png 1,131 × 506; 343 KB
 Business Case Steps.png 1,921 × 600; 372 KB
 Business Cycles Graph 1.JPG 634 × 408; 29 KB
 Business Dimensions.png 912 × 593; 176 KB
 Business Drivers Report.jpg 684 × 532; 52 KB
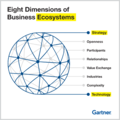 Business Ecosystem Dimensions.png 2,178 × 2,178; 1,016 KB
 Business Ecosystem Types.png 687 × 384; 115 KB
 Business Ethics.png 1,077 × 972; 185 KB
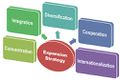 Business Expansion.jpg 500 × 341; 38 KB
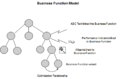 Business Function Model.png 839 × 550; 48 KB
 Business Games.png 328 × 292; 145 KB
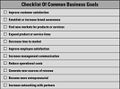 Business Goals2.jpg 535 × 396; 52 KB
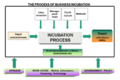 Business Incubation Process.png 435 × 291; 61 KB
 Business Lifecycle.jpg 807 × 541; 38 KB
 Business Model.png 435 × 431; 287 KB
 Business Objective.png 420 × 309; 59 KB
 Business Objective1.png 620 × 597; 28 KB
 Business Objective2.jpg 614 × 504; 83 KB
 Business Operations Functions.png 658 × 724; 311 KB
 Business Plan Elements.png 1,720 × 894; 50 KB
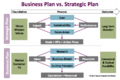 Business Plan Vs Strategic Plan.png 768 × 510; 269 KB
 Business Process.png 299 × 201; 41 KB
 Business Strategy.png 764 × 471; 256 KB
 Business Thinking Vs Innovative Thinking.png 638 × 414; 199 KB
 Business Valuation Approaches.jpg 1,024 × 527; 83 KB
 Business Value Model.png 721 × 450; 391 KB
 Business and Technical Service Catalogue.png 875 × 516; 287 KB
 Business it alignment.gif 866 × 522; 9 KB
 Business objects.jpeg 392 × 400; 21 KB
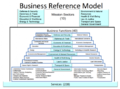 Business reference model.png 560 × 414; 180 KB
 BusinessaAnalytics.png 1,082 × 674; 267 KB
 Businessarchframework.png 990 × 478; 342 KB
 CA-ACF2.jpg 444 × 411; 30 KB
 CAPM 1.gif 312 × 107; 2 KB
 CBA vs CEA.png 2,553 × 970; 1.05 MB
 CCRA.png 467 × 319; 88 KB
 CCRA Evolution.png 446 × 341; 114 KB
 CDI.jpg 620 × 280; 29 KB
 CDP Architecture.jpg 800 × 436; 67 KB
 CDP Types.jpg 600 × 419; 55 KB
 CDP Vs DMP Vs CRM.png 2,713 × 1,772; 1.04 MB
 CDSA Layers.png 969 × 642; 156 KB
 CEA vs ECEA.png 2,234 × 1,249; 866 KB
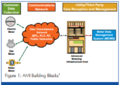
 CEH Building Blocks.jpg 1,018 × 525; 78 KB
 CEH Steps.png 767 × 713; 153 KB
 CEM.png 498 × 498; 122 KB
 CIGO Role Maturity Framework.png 700 × 307; 90 KB
 CI Example.jpg 545 × 332; 31 KB
 CI Type - Attribute.png 789 × 444; 74 KB
 CI Type - Info Sources.png 1,172 × 425; 116 KB
 CI Type - Owner.png 913 × 980; 28 KB
 CI Type - Relationships.png 1,365 × 478; 141 KB
 CI Type - Roll Out.png 936 × 342; 183 KB
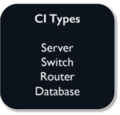 CI Types.png 313 × 300; 35 KB
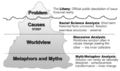 CLA Iceberg.png 850 × 502; 115 KB
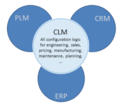 CLM.png 440 × 394; 73 KB
 CLM Vs PLM Vs ERP.png 1,017 × 497; 301 KB
 CLV Calculation Methods.jpg 989 × 596; 87 KB
 CLV by Quartile.png 787 × 443; 22 KB
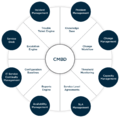 CMDB.png 1,257 × 1,233; 68 KB
 CMDB - IT Asset Management.png 1,173 × 712; 155 KB
 CMDB Admin Process.png 840 × 542; 168 KB
 CMDB Model.png 2,110 × 1,306; 134 KB
 CMMI Constellation.png 2,250 × 1,573; 1.31 MB
 CMMI Maturity Levels.png 3,132 × 2,034; 3.07 MB
 CMMI V2.png 2,201 × 1,191; 2.69 MB
 CMMleve-diagram.jpg 583 × 435; 42 KB
 COBIT5.1.jpg 451 × 259; 19 KB
 COM.png 1,365 × 534; 575 KB
 CORBA.png 449 × 433; 57 KB
 CPO Growth Chart.png 659 × 443; 75 KB
 CRM Vs CEM.png 1,620 × 1,200; 120 KB
 CSI Model.png 894 × 643; 232 KB
 CSI ongoing feedback loop.png 571 × 355; 134 KB
 CaliberatedProbability.png 526 × 270; 111 KB
 Capacity Management Components.png 921 × 615; 179 KB
 Capacity Plan Template.jpg 635 × 904; 93 KB
 CareerEdge Model.png 368 × 284; 15 KB
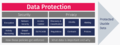
 Categories of Data Protection.png 4,150 × 1,226; 927 KB
 Category Examples of Industry.png 907 × 298; 84 KB
 Cause Effect Problem Tree.png 1,844 × 1,072; 1.6 MB
 Causes of Customer Churn.jpg 768 × 638; 25 KB
 Central ES Repository.png 2,130 × 1,654; 237 KB
 Cfo-of-it.png 1,464 × 640; 91 KB
 Chain of Command.png 2,028 × 1,282; 2.29 MB
 Chain of command vs Span of control.png 718 × 304; 125 KB
 ChangeManagement Model.png 640 × 750; 238 KB
 Change Management.png 525 × 454; 90 KB
 Change Management Model.gif 325 × 252; 29 KB
 Change Management Process.jpg 880 × 650; 102 KB
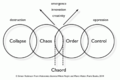 Chaordic-model-1024x682.png 1,024 × 682; 61 KB
 Chaos Theory.png 2,320 × 1,460; 757 KB
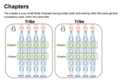 Chapters.png 2,178 × 1,457; 1.76 MB
 Characteristics of management.jpg 550 × 341; 19 KB
 Chargeback Guiding Principles.png 878 × 579; 428 KB
 Chargeback Methods.jpg 1,500 × 785; 443 KB
 ClientServerArchitecture.png 557 × 450; 80 KB
 ClientServerArchitecture1.png 595 × 390; 95 KB
 ClientServerArchitecture2.png 716 × 300; 142 KB
 Client -Server Model.png 938 × 671; 161 KB
 Client server Network.png 1,626 × 1,090; 376 KB
 Client server model.png 578 × 300; 46 KB
 Closed Loop Cycle.jpg 865 × 700; 43 KB
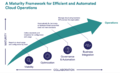 CloudOps Maturity Framework.png 1,767 × 1,080; 318 KB
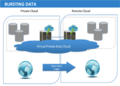 Cloud Bursting.png 996 × 715; 299 KB
 Cloud Bursting Example.png 850 × 372; 22 KB
 Cloud Computing.jpg 578 × 132; 19 KB
 Cloud Computing1.png 850 × 639; 111 KB
 Cluster Analysis.png 1,997 × 806; 256 KB
 Cobit5.jpg 638 × 478; 36 KB
 Cognitive Computing.png 2,628 × 1,708; 1.28 MB
 Cognitive Security.png 924 × 505; 359 KB
 Collaborative crm.png 577 × 414; 223 KB
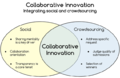 Collaborative innovation.png 630 × 410; 126 KB
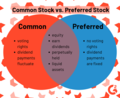 Common Stock Vs Preferred Stock.png 599 × 491; 100 KB
 Competitive Advantage.jpg 600 × 433; 15 KB
 Competitive Advantage1.png 469 × 540; 9 KB
 Compliance.png 471 × 300; 83 KB
 Compliance1.png 640 × 300; 107 KB
 Component business model.jpg 600 × 362; 75 KB
 Components of CDM.png 1,199 × 619; 192 KB
 Components of EVM.png 1,368 × 824; 593 KB
 Components of data architecture.png 700 × 340; 60 KB
 Composite application.gif 496 × 534; 72 KB
 Computer.jpg 450 × 208; 15 KB
 Computer Architecture.png 3,445 × 2,475; 491 KB
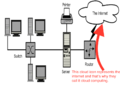
 Computer Networking.png 334 × 236; 19 KB
 Computer Security Threats.jpg 800 × 589; 84 KB
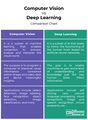 Computer Vision Vs Deep Learning.jpg 1,652 × 2,250; 428 KB
 Concept Map.jpg 1,152 × 720; 104 KB
 Concept of SAM.png 2,445 × 1,685; 127 KB
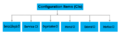 Configuration Items.png 700 × 210; 9 KB
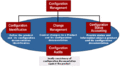 Configuration Management Process.gif 555 × 310; 16 KB
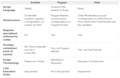 Configuration Management Tools.png 1,188 × 770; 271 KB
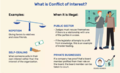 Conflict of Interest.png 1,042 × 631; 627 KB
 Congruence Model.png 521 × 292; 30 KB
 Congruence Model Elements.png 815 × 456; 44 KB
 Constructors.png 1,371 × 312; 53 KB
 Context for Enterprise Transformation.png 1,718 × 1,255; 420 KB
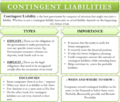 Contingent Liabilities.png 468 × 397; 115 KB
 Continuous Delivery vs Continuous Deployment.png 1,181 × 251; 16 KB
 Continuous System.jpg 306 × 164; 7 KB
 Continuous System into Discrete System.jpg 515 × 109; 10 KB
 Continuous time signal processing.png 1,374 × 510; 173 KB
 Contract Optimization Loop.png 886 × 571; 123 KB
 Core Culture.png 860 × 742; 196 KB
 Corporate-Governance.jpg 2,048 × 2,048; 400 KB
 Corporate Strategy.png 480 × 450; 216 KB
 Cost benefit analysis 250.png 250 × 250; 28 KB
 Cost optimize.png 819 × 413; 181 KB
 Countries by Industrial Output 2020.png 937 × 604; 159 KB
 Creating Brand Architecture.jpg 1,024 × 467; 17 KB
 Crisis-mgmt.png 913 × 498; 197 KB
 Crisis-mgmt1.png 1,061 × 518; 180 KB
 Crm1.png 570 × 550; 94 KB
 Cross-sell vs Upsell.png 1,027 × 538; 221 KB
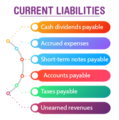 Current Liabilities.png 258 × 261; 50 KB
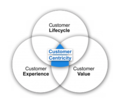 Customer Centricity Model.png 300 × 258; 47 KB
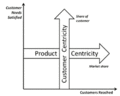 Customer Centricity Vs Product Centricity.gif 250 × 199; 5 KB
 Customer Churn.png 866 × 484; 175 KB
 Customer Churn Matrix.jpg 751 × 273; 40 KB
 Customer Concept.jpg 300 × 172; 16 KB
 Customer Data Architecture.png 2,000 × 971; 491 KB
 Customer Data Management.png 500 × 370; 97 KB
 Customer Data Ownership.png 1,182 × 1,080; 66 KB
 Customer Data Platform.jpg 600 × 300; 26 KB
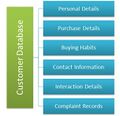 Customer Database.jpg 405 × 391; 34 KB
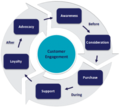 Customer Engagement Cycle.png 300 × 270; 74 KB
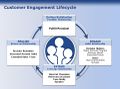 Customer Engagement Lifecycle.jpg 960 × 713; 105 KB
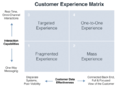 Customer Experience Matrix.png 655 × 484; 56 KB
 Customer Lifecycle.png 1,078 × 750; 131 KB
 Customer Lifecycle Stages.gif 453 × 230; 10 KB
 Customer Lifetime Value.gif 461 × 310; 10 KB
 Customer Lifetime Value Model.png 633 × 380; 133 KB
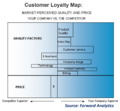 Customer Loyalty Map.png 1,464 × 1,358; 855 KB
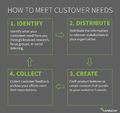 Customer Needs.png 1,404 × 1,318; 62 KB
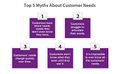 Customer Needs Myths.jpg 700 × 434; 49 KB
 Customer Perceived Value.jpg 200 × 411; 12 KB
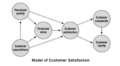 Customer Satisfaction.png 409 × 224; 41 KB
 Customer Satisfaction Example.png 1,650 × 930; 404 KB
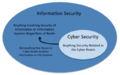 Cyber Security Vs Information Security.png 636 × 400; 122 KB
 DAD Agile Lifecycle.jpg 1,024 × 465; 53 KB
 DAD Continuous Delivery Agile Lifecycle.jpg 1,024 × 439; 44 KB
 DAD Continuous Delivery Lean Lifecycle.jpg 1,024 × 563; 50 KB
 DAD Exploratory-Lean Startup Lifecycle.jpg 1,024 × 434; 28 KB
 DAD Lean Lifecycle.jpg 1,024 × 465; 52 KB
 DAD Program Lifecycle.jpg 832 × 720; 65 KB
 DAD Roles.png 436 × 401; 94 KB
 DAD as Hybrid.png 676 × 250; 59 KB
 DAMVAM.png 887 × 405; 154 KB
 DCF Model.jpg 1,024 × 650; 120 KB
 DCOM.png 632 × 660; 95 KB
 DMAIC Process.png 889 × 454; 165 KB
 DML.jpg 500 × 240; 41 KB
 Daisy Chain.jpg 560 × 86; 9 KB
 DataQuality.png 443 × 387; 207 KB
 DataQuality1.png 304 × 300; 90 KB
 DataQuality2.png 303 × 300; 40 KB
 Data Analysis1.png 271 × 414; 30 KB
 Data Analysis2.png 604 × 450; 155 KB
 Data Analytics.png 1,144 × 609; 328 KB
 Data Cleansing.jpg 613 × 361; 29 KB
 Data Cleansing2.jpg 293 × 284; 15 KB
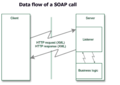 Data Flow of SOAP Call.png 1,619 × 1,143; 362 KB
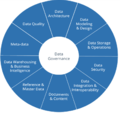
 Data Governance.png 300 × 169; 35 KB
 Data Governance1.png 818 × 770; 204 KB
 Data Governance Framework.png 984 × 606; 373 KB
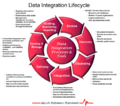 Data Integration.png 424 × 375; 130 KB
 Data Link Layer.png 600 × 145; 8 KB
 Data Management.png 514 × 375; 28 KB
 Data Management1.png 724 × 375; 144 KB
 Data Management Platform.png 4,340 × 2,029; 1.08 MB
 Data Masking.png 634 × 618; 81 KB
 Data Mining.png 623 × 525; 214 KB
 Data Mining2.png 516 × 300; 113 KB
 Data Monitoring Elements.png 2,406 × 1,066; 651 KB
 Data Munging Stages.png 3,520 × 1,839; 4.39 MB
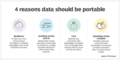 Data Portability Reasons.png 3,422 × 1,716; 1.49 MB
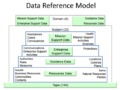 Data Reference Model.png 560 × 418; 169 KB
 Data Security Vs Data Privacy.png 1,364 × 506; 185 KB
 Data Sources.png 487 × 654; 168 KB
 Data Virtualization Architecture.png 3,221 × 1,766; 2.17 MB
 Data Warehouse.png 461 × 330; 79 KB
 Data Warehouse1.png 861 × 375; 127 KB
 Data to wisdom.png 530 × 285; 38 KB
 Database Table.png 1,008 × 416; 194 KB
 Dataflows.png 1,055 × 651; 42 KB
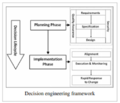 Decision Engineering Framework.png 505 × 435; 78 KB
 Decision Making Process.png 1,274 × 793; 191 KB
 Decision Model.jpg 500 × 310; 34 KB


