


IT Strategy Choices to Outcomes.png
Revision as of 20:06, 9 November 2026 by User (talk | contribs) (User uploaded a new version of File:IT Strategy Choices to Outcomes.png)


Size of this preview: 800 × 534 pixels. Other resolutions: 320 × 213 pixels | 1,024 × 683 pixels.
Original file (1,024 × 683 pixels, file size: 260 KB, MIME type: image/png)
Summary
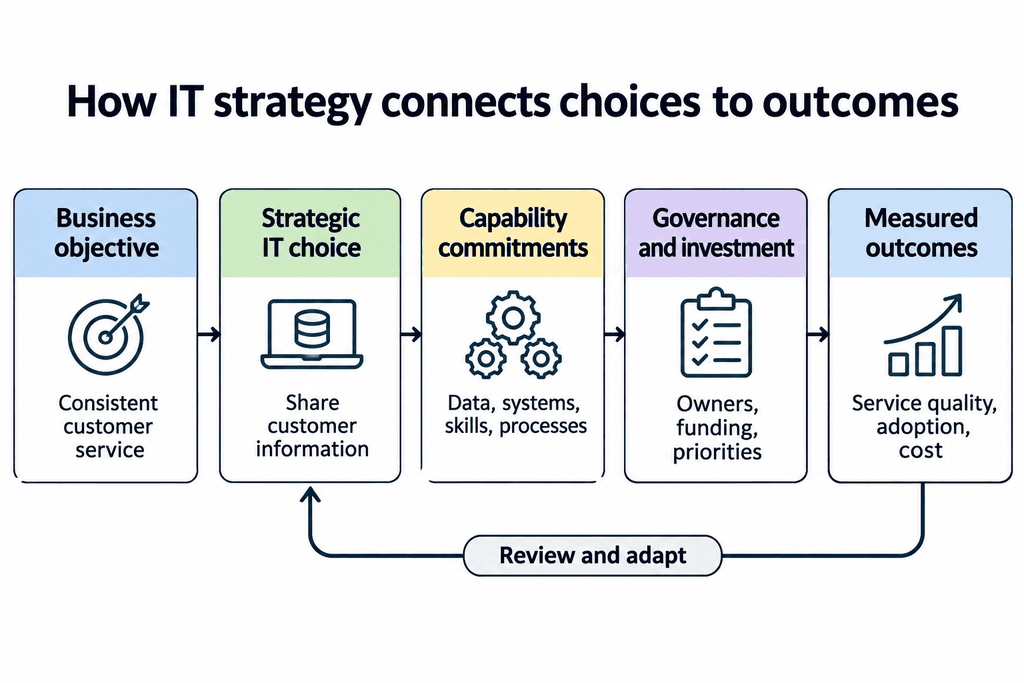
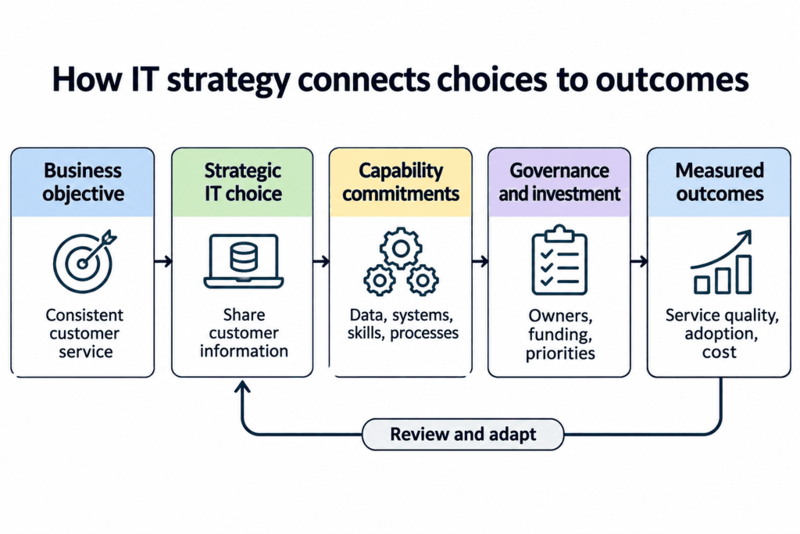
This diagram illustrates how IT strategy translates business objectives into measurable outcomes. It connects strategic technology choices with the capabilities, investments, and governance needed for execution, while emphasizing continuous review and adaptation based on results.
File history
Click on a date/time to view the file as it appeared at that time.
| Date/Time | Thumbnail | Dimensions | User | Comment | |
|---|---|---|---|---|---|
| current | 20:06, 9 November 2026 | | 1,024 × 683 (260 KB) | User (talk | contribs) | smaller file size |
| 19:54, 9 November 2026 | 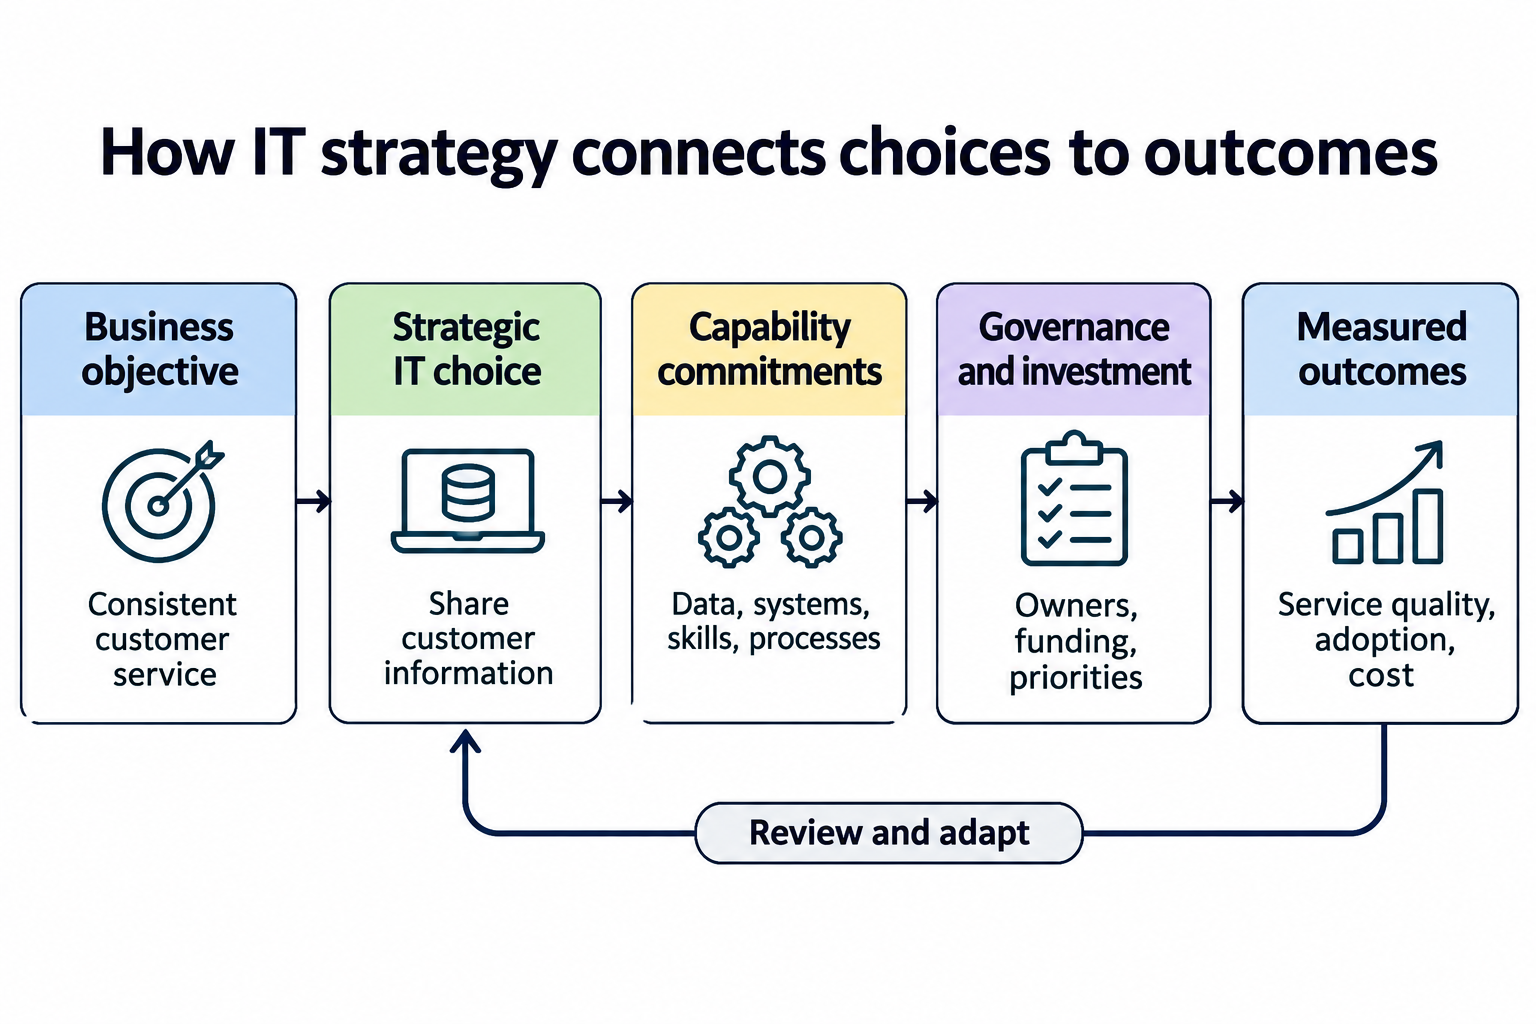 | 1,536 × 1,024 (1.22 MB) | User (talk | contribs) | This diagram illustrates how IT strategy translates business objectives into measurable outcomes. It connects strategic technology choices with the capabilities, investments, and governance needed for execution, while emphasizing continuous review and adaptation based on results. |
You cannot overwrite this file.
File usage
The following page uses this file:
