Bachman Diagram
A Bachman diagram is another name for a data structure diagram, and is used to design the data with a network or relational "logical" model, separating the data model from the way the data is stored in the system. The model is named after database pioneer Charles Bachman, and mostly used in computer software design. In a relational model a relation is the cohesion of attributes that are fully and not transitive functional dependent of every key in that relation. The coupling between the relations is based on accordant attributes. For every relation a rectangle has to be drawn and every coupling is illustrated by a line that connects the relations. On the edge of each line arrows indicate the cardinality. We have 1-to-n, 1-to-1 and n-to-n. The latter has to be avoided and must be replaced by two 1-to-n couplings.[1]
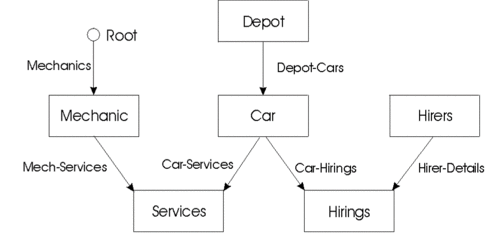
The figure below illustrates a Bachman Diagram for a Car-Hire Network Database

source: WLV
References
- ↑ What is the Bachman Diagram? Liquisearch
Further Reading
- Guidelines for Constructing Data Structure Diagrams IRS.GOV
- Charles William "Charlie" Bachman III Wikipedia
- Data Structure Diagrams By Charles W. Bachman
