Difference between revisions of "Infographic"
(Created page with "'''Content Coming Soon'''") |
|||
| Line 1: | Line 1: | ||
| − | + | ||
| + | |||
| + | Origin of Infographic | ||
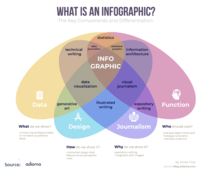
| + | The origin of the word “infographic” is a blend of “information” and “graphic” that first appeared consistently in English language books around the 1960s. The term information graphic appeared slightly before it. Today “information graphic”, “infographic”, and its shorter form “infograph” all refer to the same thing. The concept of an infographic straddles the fields of design, journalism, statistics, and information architecture. The word itself reveals two of the four components that make up an infographic: | ||
| + | *data (information) | ||
| + | *design (graphics) | ||
| + | *journalism (writing) | ||
| + | *function (information architecture) | ||
| + | Information is what is shown, the design is how it is shown, journalism is why it is shown, and the function is who it is shown to. | ||
| + | |||
| + | |||
| + | [[File:Infographic.png|200px|Infographic]]<br /> | ||
| + | |||
| + | |||
| + | How is an infographic different from its related fields? If we look at the intersections of these related fields, we can discover infographic’s relatives. | ||
| + | *generative art (data + design) – a computer generated artwork that is algorithmically determined | ||
| + | *data visualization (data + design + journalism) – techniques used to communicate data or information by encoding it as visual objects (these deal with numeric data only) | ||
| + | *statistical graphics (data + design + function) – techniques of displaying patterns found in unprocessed data | ||
| + | *technical writing (data + journalism) – use of verifiable data to support statements made by the writer | ||
| + | *data journalism (data + journalism + function) – a genre of writing that relies on verifiable data to convey a specific message, tailored to an audience | ||
| + | *statistics (data + function) – methods of extracting patterns out of unprocessed data | ||
| + | *illustrated writing (design + journalism) – use of design techniques that integrate images with an article | ||
| + | *visual journalism (design + journalism + function) – a genre of writing that integrates images and writing to reach a specific audience | ||
| + | *information architecture (design + function) – methods of structuring information that make it useful to the end user | ||
| + | *expository writing (journalism + function) – a genre of writing that explains and informs as opposed to persuade | ||
Revision as of 12:34, 2 August 2021
Origin of Infographic
The origin of the word “infographic” is a blend of “information” and “graphic” that first appeared consistently in English language books around the 1960s. The term information graphic appeared slightly before it. Today “information graphic”, “infographic”, and its shorter form “infograph” all refer to the same thing. The concept of an infographic straddles the fields of design, journalism, statistics, and information architecture. The word itself reveals two of the four components that make up an infographic:
- data (information)
- design (graphics)
- journalism (writing)
- function (information architecture)
Information is what is shown, the design is how it is shown, journalism is why it is shown, and the function is who it is shown to.
How is an infographic different from its related fields? If we look at the intersections of these related fields, we can discover infographic’s relatives.
- generative art (data + design) – a computer generated artwork that is algorithmically determined
- data visualization (data + design + journalism) – techniques used to communicate data or information by encoding it as visual objects (these deal with numeric data only)
- statistical graphics (data + design + function) – techniques of displaying patterns found in unprocessed data
- technical writing (data + journalism) – use of verifiable data to support statements made by the writer
- data journalism (data + journalism + function) – a genre of writing that relies on verifiable data to convey a specific message, tailored to an audience
- statistics (data + function) – methods of extracting patterns out of unprocessed data
- illustrated writing (design + journalism) – use of design techniques that integrate images with an article
- visual journalism (design + journalism + function) – a genre of writing that integrates images and writing to reach a specific audience
- information architecture (design + function) – methods of structuring information that make it useful to the end user
- expository writing (journalism + function) – a genre of writing that explains and informs as opposed to persuade

