
Uncategorized files
Showing below up to 100 results in range #101 to #200.
View (previous 100 | next 100) (20 | 50 | 100 | 250 | 500)
 Active Directory1.gif 335 × 259; 18 KB
 Active listening.gif 250 × 132; 4 KB
 Activity-Network-Diagram-Example-Chart.png 558 × 233; 26 KB
 Activity-based-costing.jpg 510 × 201; 58 KB
 ActivityBasedCosting.gif 640 × 480; 11 KB
 ActivityDiagram.png 688 × 726; 114 KB
 ActivityDiagram1.gif 600 × 538; 42 KB
 Activity Diagram.png 735 × 730; 86 KB
 Actor Involvement.png 900 × 532; 30 KB
 Actor Power.png 900 × 532; 33 KB
 Actor map.png 800 × 442; 119 KB
 Ad Ops.gif 550 × 373; 46 KB
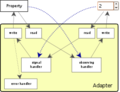 Adapter.png 283 × 218; 24 KB
 AdaptiveWebDesign.png 840 × 435; 347 KB
 Adaptive Enterprise.jpg 473 × 2,700; 249 KB
 Adaptive Enterprise1.png 450 × 450; 40 KB
 Adaptive Enterprise Framewrk.jpg 359 × 375; 44 KB
 Adaptive Security Architecture1.png 380 × 298; 64 KB
 Adaptive Strategy.png 280 × 195; 16 KB
 Adaptive Strategy1.jpg 506 × 300; 37 KB
 Adaptive learning.jpg 640 × 477; 34 KB
 Additional Devices.png 1,024 × 163; 38 KB
 AdditiveManufacturimg.png 4,000 × 2,138; 552 KB
 Addressabletv.jpg 300 × 268; 32 KB
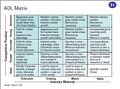 Adl matrix.jpg 554 × 412; 66 KB
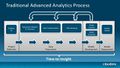 Advanced Analytics.jpg 638 × 359; 53 KB
 Advantages and Disadvantages of Matrix Management.png 400 × 234; 49 KB
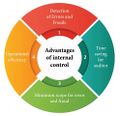 Advantages of Internal Control.jpg 494 × 479; 41 KB
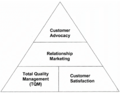 Advocacy Marketing.png 887 × 688; 104 KB
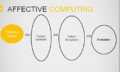 Affective Computing.png 499 × 300; 140 KB
 Affinity wall.png 800 × 627; 144 KB
 Agenda-Setting Theory-1.png 392 × 222; 58 KB
 Aggregate+demand+AD.png 320 × 168; 35 KB
 Aggregate supply.png 647 × 525; 85 KB
 Agile Modeling.jpg 642 × 375; 47 KB
 Airline Example Business Agility.png 599 × 431; 83 KB
 Albers1.png 887 × 369; 88 KB
 AlogorithmicBusiness.png 1,001 × 585; 131 KB
 Analog Signal Processing.jpg 428 × 178; 17 KB
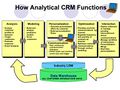 Analyticalcrm.jpg 728 × 546; 120 KB
 Analyticalcrm1.png 1,369 × 767; 389 KB
 Analyzer Strategy.png 854 × 132; 20 KB
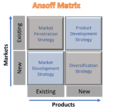 Ansoff Matrix.png 1,578 × 1,473; 105 KB
 App-Modernization.jpg 800 × 392; 40 KB
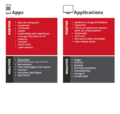 App Vs Application.png 630 × 600; 13 KB
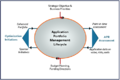 Application-Portfolio-Management-Lifecycle.png 475 × 317; 53 KB
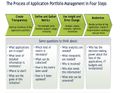 Application-Portfolio-Management-process.jpg 636 × 494; 80 KB
 Application Architecture 2 tier.png 397 × 128; 13 KB
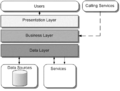
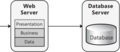
 Application Architecture 3 tier.png 498 × 128; 18 KB
 Application Architecture 4 tier.png 534 × 128; 21 KB
 Application Architecture Client Server Pattern.png 397 × 128; 10 KB
 Application Architecture Distributed Deployment.png 418 × 140; 17 KB
 Application Architecture Layers.png 397 × 302; 13 KB
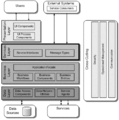 Application Architecture Layers and Components.png 416 × 421; 31 KB
 Application Architecture Non-Distributed Deployment.png 326 × 140; 14 KB
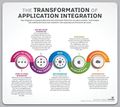 Application Integration.jpg 421 × 375; 42 KB
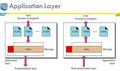
 Application Layer.png 1,837 × 1,223; 103 KB
 Application Layer Functions.jpg 444 × 264; 26 KB
 Application Management Services.png 1,192 × 396; 226 KB
 Application Modernization Value Curve.png 689 × 366; 111 KB
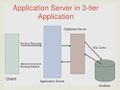 Application Server.jpg 499 × 375; 26 KB
 Application Software.jpg 360 × 305; 49 KB
 Application of Business Value Model.png 597 × 480; 370 KB
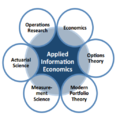 AppliedInformationEconomics1.png 512 × 499; 155 KB
 AppliedInformationEconomics2.png 451 × 450; 116 KB
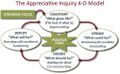 Appreciative Inquiry 4-D Model.jpg 508 × 315; 42 KB
 Architectural Pattern.gif 324 × 237; 17 KB
 Architectural Pattern1.png 1,350 × 364; 227 KB
 Architectural Pattern2.png 570 × 285; 55 KB
 Architectural Pattern3.png 858 × 480; 248 KB
 Architectural Principles.gif 262 × 192; 8 KB
 Architectural Risk.png 1,042 × 315; 142 KB
 Architectural style.png 958 × 756; 530 KB
 Architectural style1.png 956 × 291; 128 KB
 Architecturedrivenmodernization.png 647 × 507; 173 KB
 Arrow.jpg 55 × 70; 1 KB
 Artificial General Intelligence Strategies.png 975 × 260; 69 KB
 Artificial Intelligence.jpg 886 × 615; 75 KB
 Artificial Intelligence1.jpg 1,134 × 537; 101 KB
 Artificial Intelligence Applications.jpg 721 × 513; 74 KB
 Artificial Intelligence Employment Impact.png 581 × 665; 65 KB
 Artificial Intelligence Progression.png 1,236 × 508; 152 KB
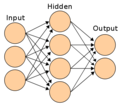 Artificial Neural Network.png 350 × 313; 34 KB
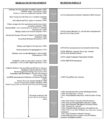 Artificial Neural Network History.png 683 × 769; 94 KB
 Artificial Neural Networks in Business.jpg 1,387 × 555; 145 KB
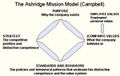 Ashridge Mission Model.jpg 399 × 252; 29 KB
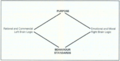 Ashridge Mission Model1.png 846 × 430; 489 KB
 Autonomous System.png 542 × 324; 74 KB
 Availability Management Principles.png 499 × 391; 57 KB
 Availability Plan Purpose.png 1,159 × 701; 447 KB
 Avoid Confirmation Bias.png 800 × 600; 88 KB
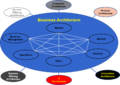 BArchitecture.png 1,484 × 1,048; 209 KB
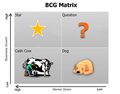 BCG-growth-matrix.jpg 446 × 349; 21 KB
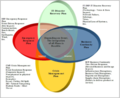 BCP.png 606 × 495; 354 KB
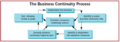
 BCPlanning.png 963 × 98; 7 KB
 BCPlanning1.png 836 × 292; 248 KB
 BIA Process Activity.jpg 932 × 720; 83 KB
 BIA Risk Assessment Difference.png 997 × 733; 413 KB
 BIOS Functions.jpg 526 × 337; 14 KB
 BITS.jpg 528 × 444; 39 KB


