
Uncategorized files
Showing below up to 250 results in range #51 to #300.
View (previous 250 | next 250) (20 | 50 | 100 | 250 | 500)
 APM-new-50.png 1,000 × 963; 637 KB
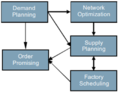 APS.png 426 × 328; 56 KB
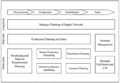 APS1.png 872 × 602; 142 KB
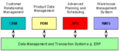 APS2.png 639 × 270; 72 KB
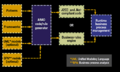 ARAD.png 671 × 400; 188 KB
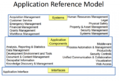 ARM.png 560 × 377; 151 KB
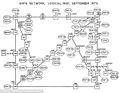 ARPANET.jpg 634 × 490; 90 KB
 ASCII.png 632 × 273; 11 KB
 ASCII2.png 635 × 268; 9 KB
 ASN.png 939 × 679; 206 KB
 ASN1 Types and Universal tags.png 1,255 × 1,287; 472 KB
 ASRM.png 608 × 615; 149 KB
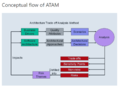
 ATAM.png 1,153 × 859; 251 KB
 ATAM1.png 1,025 × 752; 309 KB
 ATS.jpg 370 × 600; 40 KB
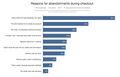
 Abandonment.png 817 × 585; 103 KB
 Abandonment1.jpg 914 × 585; 61 KB
 Abc analysis.png 900 × 643; 312 KB
 Abcanalysis.png 516 × 220; 64 KB
 Abcd.jpg 599 × 407; 36 KB
 Above the Fold.png 538 × 600; 239 KB
 Above the Fold1.jpg 849 × 450; 69 KB
 Abowd-beale.png 1,127 × 667; 179 KB
 Abowd-beale1.png 992 × 767; 72 KB
 AbsorptionCosting.gif 640 × 480; 11 KB
 Abstract class needs to be extended.png 1,362 × 150; 34 KB
 Acceptance Criteria.png 492 × 375; 55 KB
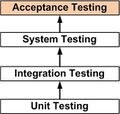 Acceptance Testing.jpg 285 × 270; 20 KB
 Acceptance Testing1.jpg 622 × 295; 33 KB
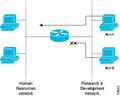 Access Control List.jpg 310 × 247; 13 KB
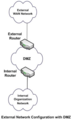 Access Control List1.png 361 × 600; 104 KB
 Access Control Using Serial Controllers.png 220 × 109; 15 KB
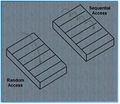 Access Method.jpg 451 × 391; 42 KB
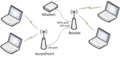 Access Point.png 808 × 401; 252 KB
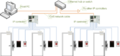 Access control system using IP controllers.png 220 × 103; 17 KB
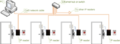 Access control system using IP readers.png 220 × 81; 14 KB
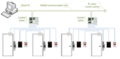
 Access control system using network-enabled main controllers.png 220 × 240; 33 KB
 Access control system using serial main and sub-controllers.png 220 × 126; 20 KB
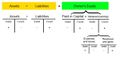 Accounting-equation.jpg 577 × 295; 37 KB
 Accounts Receivable Turnover Ratio.png 782 × 87; 11 KB
 Acquisition.png 667 × 600; 195 KB
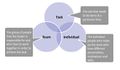 Action Centred Leadership.jpg 571 × 332; 32 KB
 Action Priority Matrix.gif 312 × 288; 26 KB
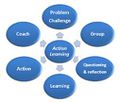 Action learning.jpg 253 × 218; 8 KB
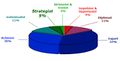 Action logic.jpg 425 × 215; 17 KB
 Action research.gif 425 × 387; 9 KB
 Active Data Dictionary.png 2,630 × 1,598; 563 KB
 Active Directory.jpg 959 × 719; 78 KB
 Active Directory1.gif 335 × 259; 18 KB
 Active listening.gif 250 × 132; 4 KB
 Activity-Network-Diagram-Example-Chart.png 558 × 233; 26 KB
 Activity-based-costing.jpg 510 × 201; 58 KB
 ActivityBasedCosting.gif 640 × 480; 11 KB
 ActivityDiagram.png 688 × 726; 114 KB
 ActivityDiagram1.gif 600 × 538; 42 KB
 Activity Diagram.png 735 × 730; 86 KB
 Actor Involvement.png 900 × 532; 30 KB
 Actor Power.png 900 × 532; 33 KB
 Actor map.png 800 × 442; 119 KB
 Ad Ops.gif 550 × 373; 46 KB
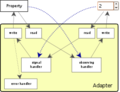 Adapter.png 283 × 218; 24 KB
 AdaptiveWebDesign.png 840 × 435; 347 KB
 Adaptive Enterprise.jpg 473 × 2,700; 249 KB
 Adaptive Enterprise1.png 450 × 450; 40 KB
 Adaptive Enterprise Framewrk.jpg 359 × 375; 44 KB
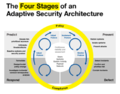 Adaptive Security Architecture1.png 380 × 298; 64 KB
 Adaptive Strategy.png 280 × 195; 16 KB
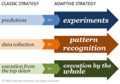
 Adaptive Strategy1.jpg 506 × 300; 37 KB
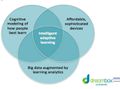 Adaptive learning.jpg 640 × 477; 34 KB
 Additional Devices.png 1,024 × 163; 38 KB
 AdditiveManufacturimg.png 4,000 × 2,138; 552 KB
 Addressabletv.jpg 300 × 268; 32 KB
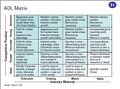 Adl matrix.jpg 554 × 412; 66 KB
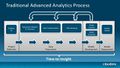 Advanced Analytics.jpg 638 × 359; 53 KB
 Advantages and Disadvantages of Matrix Management.png 400 × 234; 49 KB
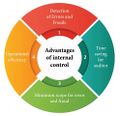 Advantages of Internal Control.jpg 494 × 479; 41 KB
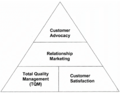 Advocacy Marketing.png 887 × 688; 104 KB
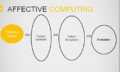 Affective Computing.png 499 × 300; 140 KB
 Affinity wall.png 800 × 627; 144 KB
 Agenda-Setting Theory-1.png 392 × 222; 58 KB
 Aggregate+demand+AD.png 320 × 168; 35 KB
 Aggregate supply.png 647 × 525; 85 KB
 Agile Modeling.jpg 642 × 375; 47 KB
 Airline Example Business Agility.png 599 × 431; 83 KB
 Albers1.png 887 × 369; 88 KB
 AlogorithmicBusiness.png 1,001 × 585; 131 KB
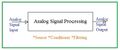 Analog Signal Processing.jpg 428 × 178; 17 KB
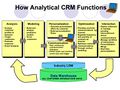 Analyticalcrm.jpg 728 × 546; 120 KB
 Analyticalcrm1.png 1,369 × 767; 389 KB
 Analyzer Strategy.png 854 × 132; 20 KB
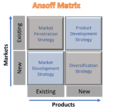 Ansoff Matrix.png 1,578 × 1,473; 105 KB
 App-Modernization.jpg 800 × 392; 40 KB
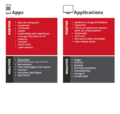 App Vs Application.png 630 × 600; 13 KB
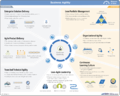
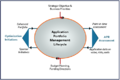 Application-Portfolio-Management-Lifecycle.png 475 × 317; 53 KB
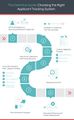
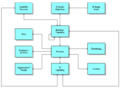
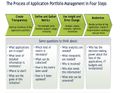 Application-Portfolio-Management-process.jpg 636 × 494; 80 KB
 Application Architecture 2 tier.png 397 × 128; 13 KB
 Application Architecture 3 tier.png 498 × 128; 18 KB
 Application Architecture 4 tier.png 534 × 128; 21 KB
 Application Architecture Client Server Pattern.png 397 × 128; 10 KB
 Application Architecture Distributed Deployment.png 418 × 140; 17 KB
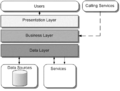 Application Architecture Layers.png 397 × 302; 13 KB
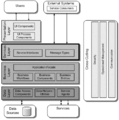 Application Architecture Layers and Components.png 416 × 421; 31 KB
 Application Architecture Non-Distributed Deployment.png 326 × 140; 14 KB
 Application Integration.jpg 421 × 375; 42 KB
 Application Layer.png 1,837 × 1,223; 103 KB
 Application Layer Functions.jpg 444 × 264; 26 KB
 Application Management Services.png 1,192 × 396; 226 KB
 Application Modernization Value Curve.png 689 × 366; 111 KB
 Application Server.jpg 499 × 375; 26 KB
 Application Software.jpg 360 × 305; 49 KB
 Application of Business Value Model.png 597 × 480; 370 KB
 AppliedInformationEconomics1.png 512 × 499; 155 KB
 AppliedInformationEconomics2.png 451 × 450; 116 KB
 Appreciative Inquiry 4-D Model.jpg 508 × 315; 42 KB
 Architectural Pattern.gif 324 × 237; 17 KB
 Architectural Pattern1.png 1,350 × 364; 227 KB
 Architectural Pattern2.png 570 × 285; 55 KB
 Architectural Pattern3.png 858 × 480; 248 KB
 Architectural Principles.gif 262 × 192; 8 KB
 Architectural Risk.png 1,042 × 315; 142 KB
 Architectural style.png 958 × 756; 530 KB
 Architectural style1.png 956 × 291; 128 KB
 Architecturedrivenmodernization.png 647 × 507; 173 KB
 Arrow.jpg 55 × 70; 1 KB
 Artificial General Intelligence Strategies.png 975 × 260; 69 KB
 Artificial Intelligence.jpg 886 × 615; 75 KB
 Artificial Intelligence1.jpg 1,134 × 537; 101 KB
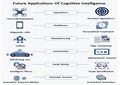 Artificial Intelligence Applications.jpg 721 × 513; 74 KB
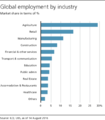 Artificial Intelligence Employment Impact.png 581 × 665; 65 KB
 Artificial Intelligence Progression.png 1,236 × 508; 152 KB
 Artificial Neural Network.png 350 × 313; 34 KB
 Artificial Neural Network History.png 683 × 769; 94 KB
 Artificial Neural Networks in Business.jpg 1,387 × 555; 145 KB
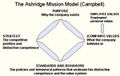 Ashridge Mission Model.jpg 399 × 252; 29 KB
 Ashridge Mission Model1.png 846 × 430; 489 KB
 Autonomous System.png 542 × 324; 74 KB
 Availability Management Principles.png 499 × 391; 57 KB
 Availability Plan Purpose.png 1,159 × 701; 447 KB
 Avoid Confirmation Bias.png 800 × 600; 88 KB
 BArchitecture.png 1,484 × 1,048; 209 KB
 BCG-growth-matrix.jpg 446 × 349; 21 KB
 BCP.png 606 × 495; 354 KB
 BCPlanning.png 963 × 98; 7 KB
 BCPlanning1.png 836 × 292; 248 KB
 BIA Process Activity.jpg 932 × 720; 83 KB
 BIA Risk Assessment Difference.png 997 × 733; 413 KB
 BIOS Functions.jpg 526 × 337; 14 KB
 BITS.jpg 528 × 444; 39 KB
 BI Model.png 1,322 × 686; 311 KB
 BMI.png 934 × 497; 782 KB
 BMIS.jpg 570 × 441; 32 KB
 BOA.png 902 × 463; 184 KB
 BPEng.png 290 × 420; 129 KB
 BPI.jpg 528 × 375; 32 KB
 BPM.png 405 × 369; 251 KB
 BPO Vs KPO.png 1,267 × 895; 347 KB
 Bachman Diagram.gif 970 × 482; 16 KB
 Backcasting.png 705 × 502; 118 KB
 Balanced-Scorecard-Graphic.jpg 4,782 × 3,576; 1.15 MB
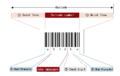 Barcode Components.png 804 × 510; 20 KB
 Bdd.jpg 260 × 231; 16 KB
 Behavioral-targeting-11-728.jpg 728 × 546; 82 KB
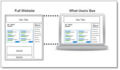 Below the Fold.png 598 × 351; 124 KB
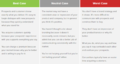
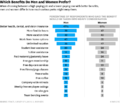 Benefits Preferred by Men and Women.png 842 × 720; 128 KB
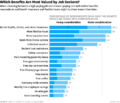 Benefits Valued by Jobseekers.png 836 × 720; 123 KB
 Benefits of Effective Communication.png 3,632 × 1,393; 166 KB
 Benefits of IT Infrastructure.png 947 × 604; 173 KB
 Better Business Case.gif 687 × 273; 29 KB
 Better Business Case1.gif 633 × 351; 41 KB
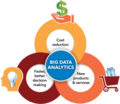 Big data imp.png 350 × 304; 45 KB
 Bimodal - Marathon Sprinter.jpg 636 × 326; 55 KB
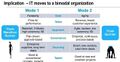
 Bimodal - Mode 1 and Mode 2.png 770 × 720; 86 KB
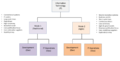 Bimodal IT Org Chart.png 1,600 × 810; 176 KB
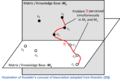 Bisociation.png 1,158 × 781; 135 KB
 Blockchain.png 1,342 × 705; 314 KB
 Blockchain1.png 1,308 × 296; 52 KB
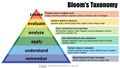 Blooms Taxonomy.jpg 650 × 366; 60 KB
 Bms.gif 430 × 233; 31 KB
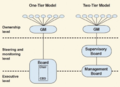 BoardOfDirectors.png 416 × 300; 138 KB
 Body.png 821 × 197; 25 KB
 Boolean Data Table.png 1,008 × 522; 168 KB
 Bottom Line.png 718 × 720; 154 KB
 Bottom of Pyramid.jpg 728 × 546; 51 KB
 Boundaryless Organization.png 960 × 239; 43 KB
 Bowtie Diagram.png 500 × 321; 117 KB
 Brainstorming Benefits.png 847 × 345; 79 KB
 Brand Ambassador.gif 638 × 382; 68 KB
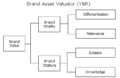 Brand Asset Valuator.png 660 × 430; 17 KB
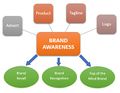 Brand Awareness.jpg 415 × 323; 28 KB
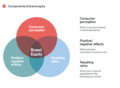 Brand Equity.png 1,800 × 1,317; 98 KB
 Brand Identity.jpg 500 × 190; 18 KB
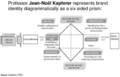 Brand identity prism1.png 850 × 546; 210 KB
 Brand identity prism2.jpg 750 × 408; 105 KB
 Brand strategy.png 1,294 × 686; 496 KB
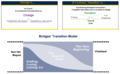 Bridges Transition Model.png 1,118 × 687; 315 KB
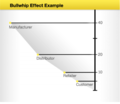 Bullwhipeffect1.png 868 × 755; 216 KB
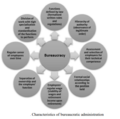 Bureaucracy.png 593 × 586; 177 KB
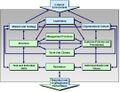 Burke-Litwin Model.jpg 538 × 413; 52 KB
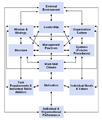 Burkelitwinmodel.png 455 × 537; 63 KB
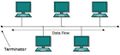 Bus Topology.jpg 560 × 257; 22 KB
 Business-architecture-template.jpg 580 × 435; 67 KB
 Business-conceptual-model.jpg 960 × 720; 69 KB
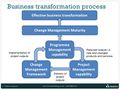 Business-transformation.jpg 728 × 546; 83 KB
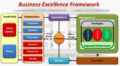 BusinessExcellence.png 917 × 505; 690 KB
 BusinessFunction.png 953 × 690; 717 KB
 BusinessFunction1.png 984 × 577; 199 KB
 BusinessFunction2.png 988 × 658; 179 KB
 BusinessITAlignment.png 298 × 285; 51 KB
 BusinessModelElements.png 485 × 622; 245 KB
 BusinessProcessArchitecture.png 740 × 538; 211 KB
 BusinessProcessArchitecture1.png 798 × 418; 118 KB
 Business Activity.jpg 332 × 103; 9 KB
 Business Agility.png 1,813 × 1,447; 829 KB
 Business Agility Domains.png 1,124 × 1,125; 631 KB
 Business Agility Value Stream.png 3,149 × 855; 542 KB
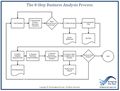 Business Analysis Process.jpg 925 × 705; 93 KB
 Business Capability.png 1,018 × 163; 93 KB
 Business Capability1.png 672 × 498; 48 KB
 Business Capability2.png 1,131 × 506; 343 KB
 Business Case Steps.png 1,921 × 600; 372 KB
 Business Cycles Graph 1.JPG 634 × 408; 29 KB
 Business Dimensions.png 912 × 593; 176 KB
 Business Drivers Report.jpg 684 × 532; 52 KB
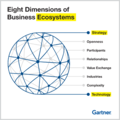 Business Ecosystem Dimensions.png 2,178 × 2,178; 1,016 KB
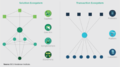 Business Ecosystem Types.png 687 × 384; 115 KB
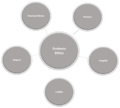 Business Ethics.png 1,077 × 972; 185 KB
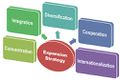 Business Expansion.jpg 500 × 341; 38 KB
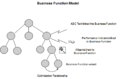 Business Function Model.png 839 × 550; 48 KB
 Business Games.png 328 × 292; 145 KB
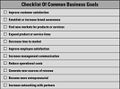 Business Goals2.jpg 535 × 396; 52 KB
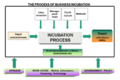 Business Incubation Process.png 435 × 291; 61 KB
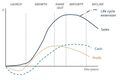 Business Lifecycle.jpg 807 × 541; 38 KB
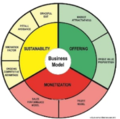 Business Model.png 435 × 431; 287 KB
 Business Objective.png 420 × 309; 59 KB
 Business Objective1.png 620 × 597; 28 KB
 Business Objective2.jpg 614 × 504; 83 KB
 Business Operations Functions.png 658 × 724; 311 KB
 Business Plan Elements.png 1,720 × 894; 50 KB
 Business Plan Vs Strategic Plan.png 768 × 510; 269 KB
 Business Process.png 299 × 201; 41 KB
 Business Strategy.png 764 × 471; 256 KB
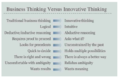 Business Thinking Vs Innovative Thinking.png 638 × 414; 199 KB
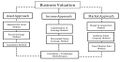 Business Valuation Approaches.jpg 1,024 × 527; 83 KB
 Business Value Model.png 721 × 450; 391 KB
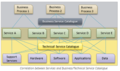 Business and Technical Service Catalogue.png 875 × 516; 287 KB
 Business it alignment.gif 866 × 522; 9 KB
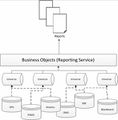 Business objects.jpeg 392 × 400; 21 KB
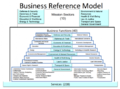 Business reference model.png 560 × 414; 180 KB


