
Uncategorized files
Showing below up to 250 results in range #501 to #750.
View (previous 250 | next 250) (20 | 50 | 100 | 250 | 500)
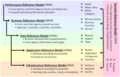
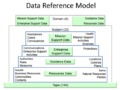 Data Reference Model.png 560 × 418; 169 KB
 Data Security Vs Data Privacy.png 1,364 × 506; 185 KB
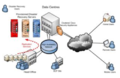
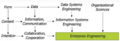
 Data Sources.png 487 × 654; 168 KB
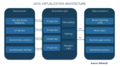 Data Virtualization Architecture.png 3,221 × 1,766; 2.17 MB
 Data Warehouse.png 461 × 330; 79 KB
 Data Warehouse1.png 861 × 375; 127 KB
 Data to wisdom.png 530 × 285; 38 KB
 Database Table.png 1,008 × 416; 194 KB
 Dataflows.png 1,055 × 651; 42 KB
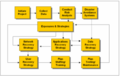
 Decision Engineering Framework.png 505 × 435; 78 KB
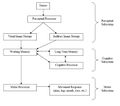
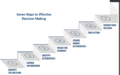 Decision Making Process.png 1,274 × 793; 191 KB
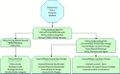 Decision Model.jpg 500 × 310; 34 KB
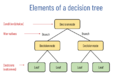 Decision Tree.png 715 × 450; 29 KB
 Defender Strategy.png 845 × 190; 35 KB
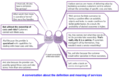 Definition and Meaning of Services.png 964 × 631; 352 KB
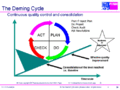 Deming Cycle.gif 498 × 374; 25 KB
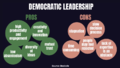 Democratic Leadership.png 768 × 432; 253 KB
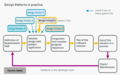 Design Pattern.png 3,705 × 2,330; 2.29 MB
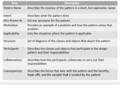 Design Pattern Structure.png 592 × 421; 77 KB
 Developing Mission Statement.png 942 × 796; 223 KB
 Differences between the old and new paradigm of management.png 1,370 × 768; 405 KB
 Differentiation Strategy.png 480 × 360; 31 KB
 Digital-strategy.jpg 535 × 305; 16 KB
 Digital Divide.jpg 768 × 534; 103 KB
 Digital Signal Processing.png 1,500 × 1,125; 275 KB
 Digital Transformation.jpg 640 × 450; 57 KB
 Digital Transformation Approach.png 700 × 496; 249 KB
 Digital Transformation Levers.png 700 × 330; 27 KB
 Digital Transformation Model.png 951 × 616; 547 KB
 Digital Transformation Stages.png 880 × 690; 274 KB
 Digital Twin.jpg 875 × 462; 75 KB
 Digitaldistruption.png 801 × 538; 640 KB
 Digitaltrust.png 636 × 363; 100 KB
 Dimensions of IT Operating Model.png 867 × 364; 345 KB
 DisasterRecoveryPlan.png 495 × 321; 184 KB
 DisasterRecoveryPlan2.png 748 × 435; 407 KB
 DisasterRecoveryPlanning.png 495 × 399; 6 KB
 DisasterRecoveryPlanning1.png 632 × 398; 83 KB
 DisasterRecoveryPlanning2.png 1,018 × 638; 330 KB
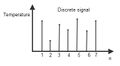 Discrete System.jpg 323 × 177; 8 KB
 Discrete time signal processing.png 1,374 × 582; 272 KB
 Disruptive Technology1.png 1,793 × 1,071; 1.14 MB
 Disruptive Technology Evolution.png 723 × 422; 51 KB
 Disruptive Technology Stages.png 860 × 280; 111 KB
 Disruptive innovation.png 587 × 377; 111 KB
 Disruptive innovation1.png 1,059 × 568; 451 KB
 Disruptivetechnology.JPG 400 × 301; 39 KB
 Distributed computing.png 486 × 718; 89 KB
 Dodaf.jpg 321 × 260; 17 KB
 Dodaf1.jpg 180 × 130; 11 KB
 Dodaf2.jpg 239 × 268; 29 KB
 Dodaf3.jpg 479 × 342; 59 KB
 Drivers of employee engagement.png 600 × 417; 192 KB
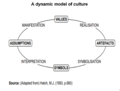 Dynamic Model of Culture.png 1,779 × 1,344; 530 KB
 Dynamic NAT.jpg 257 × 115; 12 KB
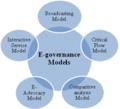 E-Governance.gif 222 × 202; 16 KB
 E-Governance1.jpg 368 × 300; 21 KB
 E-Kanban System.png 1,250 × 900; 373 KB
 EA.jpg 769 × 574; 59 KB
 EAI.png 806 × 375; 135 KB
 EAI1.png 615 × 375; 34 KB
 EAM.jpg 630 × 447; 53 KB
 EAM1.png 766 × 450; 63 KB
 EAS Development.jpg 718 × 406; 49 KB
 EAVF.png 589 × 393; 117 KB
 EAssetM.png 361 × 360; 120 KB
 EAssetM1.png 513 × 375; 125 KB
 EAssetM2.jpg 418 × 426; 25 KB
 EAssetM3.png 542 × 450; 240 KB
 ECM.png 501 × 324; 157 KB
 ECR.png 953 × 443; 804 KB
 EDRM.png 1,200 × 583; 574 KB
 EFD.png 758 × 516; 110 KB
 EII.jpg 305 × 224; 17 KB
 EII1.png 545 × 390; 322 KB
 EIM.jpg 476 × 287; 39 KB
 EIM1.jpg 646 × 420; 82 KB
 EIS.png 418 × 450; 162 KB
 EIS2.png 639 × 375; 161 KB
 EIS3.png 621 × 599; 162 KB
 EISA.png 1,901 × 919; 84 KB
 EMM Stages.png 465 × 133; 43 KB
 ERM.png 724 × 469; 328 KB
 ERM2.png 793 × 703; 475 KB
 ERP.png 527 × 458; 332 KB
 ERP1.png 649 × 521; 276 KB
 ERP2.png 420 × 296; 26 KB
 ESB.png 755 × 592; 70 KB
 ESM Reference Representation.png 2,097 × 1,168; 574 KB
 EStrategy.jpg 793 × 450; 68 KB
 EStrategy1.jpg 430 × 450; 30 KB
 EStrategy2.jpg 713 × 450; 59 KB
 EVA.gif 416 × 213; 14 KB
 EVP Attraction Driven Benchmark.png 376 × 307; 42 KB
 Ea-lifecycle-ealc.png 1,084 × 550; 56 KB
 Earned Value Management.jpg 639 × 360; 40 KB
 Ebusmodel.gif 353 × 522; 8 KB
 Ecommerce.png 646 × 450; 224 KB
 Economic Capital (EC).png 2,837 × 1,398; 605 KB
 Economic Impact Analysis.png 1,560 × 1,795; 823 KB
 Edi.png 857 × 523; 243 KB
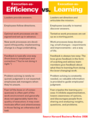 Education as Learning vs Education as Efficiency.png 1,320 × 1,741; 1.7 MB
 Effort Estimation.png 400 × 720; 112 KB
 Efqm model.png 1,206 × 473; 420 KB
 Efqm model fundamental.jpg 700 × 353; 37 KB
 Electronic System.png 815 × 173; 133 KB
 Elements of Capacity Plan.png 586 × 248; 36 KB
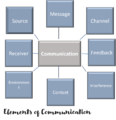 Elements of Communication.png 1,512 × 1,570; 87 KB
 Elements of IT Operating Model.png 913 × 479; 403 KB
 Eli Lilly First Principle Approach.png 2,426 × 1,750; 617 KB
 Embedded System.jpeg 556 × 346; 41 KB
 Empirical Approaches.png 3,727 × 1,349; 755 KB
 Employability.png 827 × 470; 69 KB
 Employee Attitude Survey Template.png 901 × 1,022; 373 KB
 Employee Benefits.png 1,037 × 995; 561 KB
 Employee Collaboration.png 536 × 320; 116 KB
 Employee Engagement.png 1,021 × 727; 267 KB
 Employee Lifecycle.png 498 × 558; 63 KB
 Employee Onboarding Process.png 600 × 518; 204 KB
 Employee Value Proposition.png 1,086 × 720; 184 KB
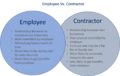 Employees Vs Contractor.png 1,066 × 674; 83 KB
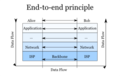 End to End.png 300 × 189; 15 KB
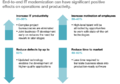 End to End IT Modernization.png 734 × 511; 99 KB
 Enterprise-architecture-lifecycle.jpg 638 × 479; 89 KB
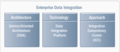 EnterpriseDataInt.png 867 × 375; 159 KB
 Enterprise Agility1.png 637 × 375; 168 KB
 Enterprise Agility2.png 386 × 375; 150 KB
 Enterprise Agility3.png 505 × 375; 75 KB
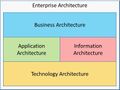
 Enterprise Architecture.png 421 × 450; 223 KB
 Enterprise Architecture1.png 317 × 375; 97 KB
 Enterprise Architecture2.png 779 × 300; 122 KB
 Enterprise Architecture Governance - Scope.png 979 × 687; 675 KB
 Enterprise Architecture Governance Model.jpg 396 × 623; 73 KB
 Enterprise Data Warehouse.png 548 × 375; 215 KB
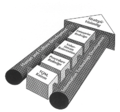
 Enterprise Engineering.png 838 × 285; 131 KB
 Enterprise Engineering1.png 401 × 375; 40 KB
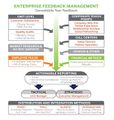 Enterprise Feedback Management.jpg 497 × 525; 68 KB
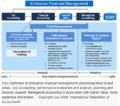 Enterprise Financial Management.png 692 × 612; 590 KB
 Enterprise Information Architecture.gif 207 × 240; 7 KB
 Enterprise Information Portal1.gif 337 × 228; 8 KB
 Enterprise Integration.png 367 × 375; 34 KB
 Enterprise Release Management.png 3,608 × 1,757; 1.82 MB
 Enterprise Software Market.jpg 800 × 464; 33 KB
 Enterprise mobility.png 1,176 × 613; 246 KB
 Envelope.png 834 × 137; 8 KB
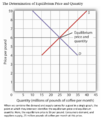 Equilibrium Price.png 847 × 928; 206 KB
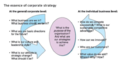 Essence of Corporate Strategy.png 579 × 325; 179 KB
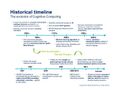 Evolution of Cognitive Computing.jpg 638 × 493; 70 KB
 Evolution of Customer Engagement.png 600 × 602; 85 KB
 Evolution of Marketing Technology.png 4,125 × 1,566; 1.99 MB
 Example of Complete Soap Message.png 816 × 404; 66 KB
 Example of Object Diagram.png 2,572 × 1,785; 1.22 MB
 Expected Return.png 745 × 431; 15 KB
 Expedia group consolidated operations statement.png 1,368 × 770; 356 KB
 Exposed Ads.png 1,024 × 159; 36 KB
 FCAPS Model.png 958 × 706; 710 KB
 FCI vs CUI.png 685 × 399; 46 KB
 FCM Model.gif 840 × 542; 16 KB
 FEAF-wikipedia.jpg 320 × 227; 19 KB
 FEA Consolidated Reference Model.png 360 × 232; 74 KB
 FISMA Requirements.png 1,105 × 458; 359 KB
 Facilitative Leadership.png 1,631 × 1,652; 1,013 KB
 Factors of IFW.png 2,400 × 1,375; 1.84 MB
 Factors of worker status under common law.png 645 × 440; 198 KB
 Factors of worker status under economic realities.png 640 × 328; 144 KB
 Fault element.png 842 × 415; 56 KB
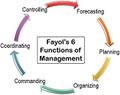 Fayols 6 Functions of Management.jpg 400 × 316; 17 KB
 Feature driven Roadmap.png 2,134 × 880; 202 KB
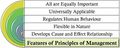 Features of Principles of Management.jpg 450 × 181; 22 KB
 Fedex.jpg 1,000 × 596; 25 KB
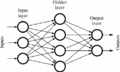 Feedforward Neural Network.png 472 × 284; 20 KB
 Financial Services Business Agility.png 591 × 120; 10 KB
 Firewall.png 2,574 × 853; 766 KB
 First Principle Thinking.png 2,503 × 1,331; 348 KB
 First Principle in Business.png 3,637 × 2,046; 3.55 MB
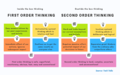 First order Vs Second order.png 2,875 × 1,790; 1.12 MB
 Five Case Model.gif 507 × 256; 16 KB
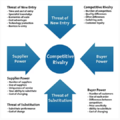 Five Forces.png 540 × 540; 203 KB
 Five Forces1.png 294 × 400; 93 KB
 Flat Org Structure.png 707 × 294; 17 KB
 Flat organization.png 981 × 222; 8 KB
 FlexibleFirm.png 448 × 450; 92 KB
 Force Field Analysis.png 1,635 × 909; 358 KB
 Forces of Organizational Change.jpg 440 × 192; 19 KB
 Four Faces of CFO.jpg 1,592 × 1,092; 139 KB
 Full Cone NAT.png 400 × 180; 6 KB
 Function-Point-02.png 785 × 610; 89 KB
 GDPR Roadmap.jpg 768 × 511; 66 KB
 GDPR Timeline.png 705 × 769; 180 KB
 GE-McKinsey-matrix-1.png 400 × 197; 32 KB
 GMAPs.png 915 × 898; 152 KB
 GOMS.png 800 × 773; 28 KB
 GRC Current State.jpg 630 × 594; 75 KB
 GRC Elements.png 300 × 275; 39 KB
 GRC Future State.jpg 560 × 599; 71 KB
 GRC Practices.jpg 528 × 266; 35 KB
 GRC Scope.png 960 × 305; 115 KB
 Galbraiths Start Model Questions.png 614 × 322; 26 KB
 Garbage Can Model.png 1,677 × 914; 343 KB
 Gartner-IT-Strategy-Model.jpg 585 × 266; 61 KB
 GartnerPaceLayered.png 678 × 356; 31 KB
 GartnerPaceLayered1.png 1,026 × 598; 297 KB
 GartnerPaceLayered2.png 815 × 561; 77 KB
 GartnerPaceLayered3.png 750 × 513; 73 KB
 Gartner Business Value Model.png 553 × 355; 101 KB
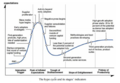
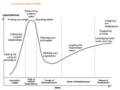
 Gartner Hype Cycle.png 872 × 600; 62 KB
 Gartner IT Governance Model.jpg 960 × 720; 84 KB
 Gartner Market Forecast.png 1,030 × 584; 68 KB
 Gartner Market Guide.jpg 979 × 625; 24 KB
 Ge vs bcg.png 1,130 × 667; 33 KB
 General Systems Theory.png 3,219 × 1,445; 1.43 MB
 General digital watermark lifecycle phases.png 600 × 175; 26 KB
 Goal Oriented Roadmap.png 300 × 212; 19 KB
 Graph Data Model.jpg 337 × 491; 19 KB
 Guilds.png 2,315 × 1,523; 2.02 MB
 HCI.png 617 × 375; 74 KB
 HCI1.jpg 401 × 3,000; 196 KB
 HCM.jpg 446 × 375; 33 KB
 HCM1.png 698 × 375; 100 KB
 HRIS.png 1,020 × 399; 290 KB
 HRIS1.jpg 407 × 375; 29 KB
 HRM.png 832 × 360; 134 KB
 HRM1.png 761 × 501; 601 KB
 HR vs People vs Workforce Analytics.png 2,354 × 1,709; 1.27 MB
 HTTP Request Response Model.png 1,539 × 1,108; 275 KB
 Header.png 822 × 208; 12 KB
 Heart Framework.png 474 × 356; 76 KB
 Hierarchical Org Structure.png 674 × 343; 25 KB
 Hierarchy of Consulting Purposes.png 827 × 763; 111 KB
 Hierarchy of Effects.jpg 220 × 363; 18 KB
 Hierarchy of controls.jpg 400 × 238; 11 KB
 High Level Language.jpg 638 × 479; 53 KB
 Holacracy Org Chart.png 917 × 940; 59 KB
 How ACR Works.png 1,024 × 609; 232 KB
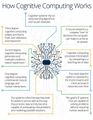 How Cognitive Computing Works.jpg 560 × 720; 114 KB
 How Self-Efficacy Develops.png 518 × 421; 246 KB
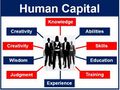 Human Capital1.jpg 299 × 225; 25 KB
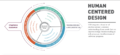 Human Centered Design.png 700 × 323; 75 KB
 Human Processor Model.jpg 650 × 575; 44 KB
 Hybrid Topology.jpg 560 × 404; 29 KB
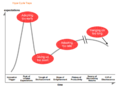
 Hype Cycle Phases indicators.png 1,111 × 765; 589 KB
 Hype Cycle Traps.png 1,007 × 730; 251 KB
 Hype Cyle Opportunities.png 966 × 727; 218 KB
 IAF.png 543 × 386; 93 KB
 IASB.png 1,026 × 352; 159 KB
 IASB1.png 504 × 375; 49 KB
 IBM AoT Structure.jpg 300 × 184; 12 KB
 IBM Aot Org.jpg 536 × 243; 15 KB
 ICF - 21st Century.png 2,142 × 1,506; 997 KB
 ICS.jpg 1,150 × 690; 100 KB


.png)


