
Uncategorized files
Showing below up to 449 results in range #1,001 to #1,449.
View (previous 500 | next 500) (20 | 50 | 100 | 250 | 500)
 OSI Application Layer.png 600 × 145; 8 KB
 OSI Model Layers.png 613 × 419; 92 KB
 OSI Model Vs TCPIP Model.png 744 × 481; 184 KB
 Object Diagram - Example 1.png 2,407 × 2,066; 670 KB
 Object Diagram - Example 2.png 2,911 × 1,697; 662 KB
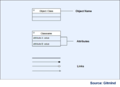 Object Diagram Notations and Symbols.png 2,338 × 1,693; 423 KB
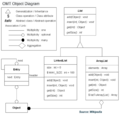 Object Modeling Technique.png 2,515 × 2,404; 586 KB
 Object drive product roadmap.png 2,126 × 1,348; 298 KB
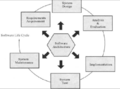
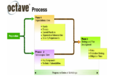 Octave Process.png 848 × 543; 164 KB
 Onlinetrustmodel.png 642 × 322; 57 KB
 Open Systems theory.png 1,966 × 1,009; 26 KB
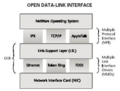 Open data-link interface.png 372 × 281; 56 KB
 Operating Model.gif 339 × 257; 49 KB
 Operating system.png 512 × 450; 207 KB
 Operational Analytics.png 3,895 × 2,327; 7.78 MB
 Operational Risk Events.png 1,125 × 644; 611 KB
 Operationalcrm.png 1,081 × 632; 481 KB
 Operationalcrm2.png 1,370 × 766; 392 KB
 Operationlcrm1.png 622 × 315; 117 KB
 Operations Managed by Service Desk.png 450 × 450; 9 KB
 Operations management.png 570 × 161; 58 KB
 Operator method.png 1,365 × 441; 92 KB
 Organic Model of Organization.jpg 501 × 502; 40 KB
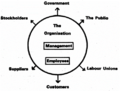
 Organization.jpg 479 × 496; 52 KB
 Organization Design.png 699 × 405; 56 KB
 Organization Design1.gif 468 × 361; 38 KB
 Organizational Change Phases.png 624 × 443; 82 KB
 Organizational Chart.gif 477 × 503; 56 KB
 Organizational Effectiveness Models.png 1,000 × 685; 260 KB
 Organizational Efficiency.png 845 × 412; 457 KB
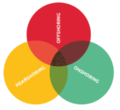
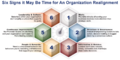 Organizational Realignment.png 1,080 × 537; 260 KB
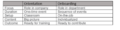 Orientation Vs Onboarding.png 984 × 250; 74 KB
 Outsourcing.png 489 × 450; 74 KB
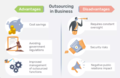 Outsourcing advantages and disadvantages.png 1,002 × 654; 365 KB
 Overlapping NAT.jpg 332 × 115; 12 KB
 Overloading NAT.jpg 353 × 115; 15 KB
 Overview of HCI Issues.png 1,818 × 1,396; 1.29 MB
 Overview of OSI Model.png 644 × 260; 140 KB
 PCCM1.jpg 300 × 234; 11 KB
 PCCM2.png 569 × 360; 117 KB
 PCC Errors of Prediction.gif 125 × 40; 2 KB
 PCC Expression.gif 15 × 27; 1,009 bytes
 PCC Product-Moment.gif 92 × 36; 2 KB
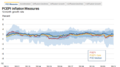 PCEPI Inflation Measures.png 653 × 365; 94 KB
 PCI DSS Compliance Levels.png 570 × 210; 6 KB
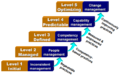
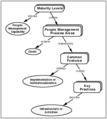 PCMM.png 336 × 375; 18 KB
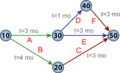 PERT.png 1,180 × 720; 152 KB
 PG brand.jpg 1,000 × 446; 33 KB
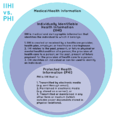 PHI Vs IIHI.png 718 × 751; 246 KB
 PII.png 736 × 767; 131 KB
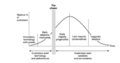
 PLC.gif 260 × 185; 10 KB
 PLC Stages.jpg 960 × 212; 28 KB
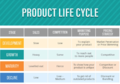 PLC Table.png 1,095 × 770; 736 KB
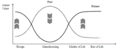
 PLC and TLC.png 804 × 424; 28 KB
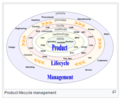 PLM.png 596 × 497; 251 KB
 PLM Future.png 902 × 371; 70 KB
 PLM Interconnected Framework.png 546 × 313; 165 KB
 PPMLifecycle.gif 538 × 373; 21 KB
 PPM Growth Share Matrix.jpg 476 × 298; 23 KB
 PPMno.png 775 × 574; 1.04 MB
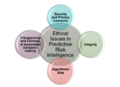 PRI Ethical Issues.png 427 × 309; 86 KB
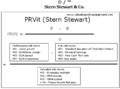 PRVit.png 745 × 553; 83 KB
 PaaS Partnerships.png 952 × 218; 170 KB
 Partial Org Realignment.jpg 699 × 615; 118 KB
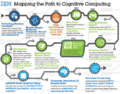 Path of Cognitive Computing.png 538 × 423; 287 KB
 Pattern Language.png 2,777 × 1,790; 1.48 MB
 Pattern Language what why how.png 2,081 × 1,705; 1.97 MB
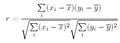 Pearson CorrelationCoefficent.png 271 × 98; 11 KB
 Pearson Correlation Coefficent.png 1,260 × 767; 98 KB
 Pearson Correlation Table.png 1,364 × 768; 180 KB
 Peer-to-Peer Model.png 1,094 × 775; 322 KB
 Peer-to-peer Network.png 877 × 1,073; 302 KB
 PerformanceAppraisal.png 572 × 45; 9 KB
 PerformanceAppraisal1.png 658 × 96; 25 KB
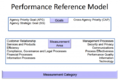 Performance Reference Model.png 560 × 380; 118 KB
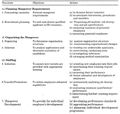 Personnel Management.jpg 625 × 592; 98 KB
 Personnel Management1.png 495 × 375; 44 KB
 Physical Layer.png 600 × 145; 3 KB
 Point to Point Topology.jpg 560 × 101; 11 KB
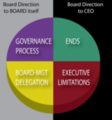 PolicyGovernance.png 323 × 347; 87 KB
 Policy Model.png 1,986 × 806; 314 KB
 Port Restricted Cone NAT.png 400 × 180; 6 KB
 Predictive Analytics.png 1,337 × 675; 392 KB
 Predictive Modeling.png 1,280 × 527; 279 KB
 Presentation Layer.png 600 × 145; 4 KB
 Private Cloud.png 500 × 400; 13 KB
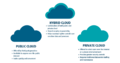 Private Cloud vs Public Cloud vs Hybrid Cloud.png 1,066 × 556; 100 KB
 Proactive Problem Management.png 641 × 357; 26 KB
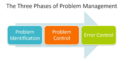 Problem Management Phases.png 1,053 × 532; 267 KB
 Problem Management Process.jpg 560 × 475; 39 KB
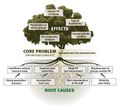 Problem Tree.jpg 788 × 720; 108 KB
 Problem solving approach.jpg 1,281 × 801; 83 KB
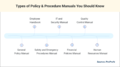 Procedure Manual Types.png 2,784 × 1,553; 605 KB
 Process.jpg 286 × 379; 10 KB
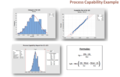 Process Capability Example.png 3,300 × 2,112; 1.82 MB
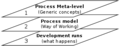 Process Model.png 300 × 115; 6 KB
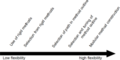 Process Model Flexibility Method.png 300 × 150; 21 KB
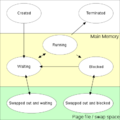 Process States.png 400 × 400; 29 KB
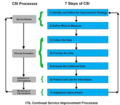 Processes of CSI.png 838 × 732; 484 KB
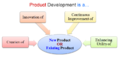 Product Development.png 743 × 359; 49 KB
 Product Development Process.png 300 × 134; 33 KB
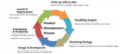
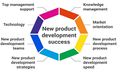 Product Development Success Factors.jpg 837 × 500; 73 KB
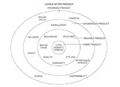 Product Levels.png 469 × 339; 90 KB
 Product Lifecycle Management.png 906 × 757; 343 KB
 Product Portfolio.png 521 × 406; 32 KB
 Product Portfolio Apple Inc.png 1,220 × 720; 148 KB
 Product Portfolio J and J.png 871 × 720; 110 KB
 Product Portfolio Kodak.png 800 × 586; 62 KB
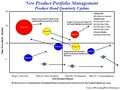 Product Portfolio Management.jpg 3,000 × 2,250; 546 KB
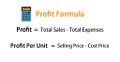 Profit Fomula.jpg 1,024 × 526; 47 KB
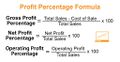 Profit Percentage Formula.jpg 1,024 × 526; 89 KB
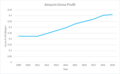 Profitability.png 604 × 373; 5 KB
 Program Management Vs Project Management.png 917 × 720; 149 KB
 Progressive Enhancement.png 418 × 300; 117 KB
 ProjectLifeCycleGraph.jpg 454 × 248; 12 KB
 Project Governance.jpg 450 × 337; 33 KB
 Project Governance Framework and Components.png 2,426 × 1,520; 2.81 MB
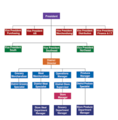
 Project Governance Roles.png 4,142 × 1,766; 5.58 MB
 Project Management Phases.png 852 × 276; 35 KB
 Project Org Structure.png 530 × 343; 37 KB
 Project Vs Portfolio Vs Program.png 1,001 × 445; 148 KB
 Prospector Strategy.png 850 × 171; 14 KB
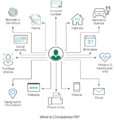
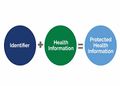 Protected Health Information.jpg 720 × 518; 29 KB
 Pseudocode.png 565 × 214; 14 KB
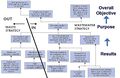 Purpose Objective Results.jpg 935 × 606; 149 KB
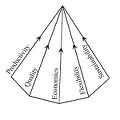 Pyramid of Production Systems.jpg 240 × 240; 9 KB
 QA Vs QC.png 723 × 470; 230 KB
 QCI Model.png 912 × 524; 676 KB
 QMS Principles.JPG 393 × 382; 15 KB
 Quality Assurance Process.png 476 × 261; 13 KB
 Quality Management Maturity Grid.png 2,922 × 1,595; 2.46 MB
 Quantum Computing - Entanglement.png 731 × 461; 116 KB
 Quantum Computing - Interference.png 1,043 × 321; 94 KB
 Quantum Computing - Supposition.png 506 × 570; 80 KB
 Quick-ratio-example.jpg 625 × 75; 13 KB
 Quick-ratio-formula.jpg 625 × 75; 13 KB
 RACF.png 841 × 569; 413 KB
 RACI Matrix.jpg 1,240 × 673; 152 KB
 RAROC.gif 454 × 52; 2 KB
 RAROC1.jpg 672 × 351; 65 KB
 RBT Process.jpg 481 × 344; 112 KB
 RCSA.png 2,750 × 1,650; 1.3 MB
 RFID.png 1,782 × 600; 398 KB
 RFM Analysis.png 780 × 540; 83 KB
 RPC.gif 414 × 364; 3 KB
 RPC1.jpg 545 × 426; 45 KB
 RPC2.gif 431 × 339; 9 KB
 RPC3.gif 264 × 254; 6 KB
 RPC Style Communication.png 610 × 166; 5 KB
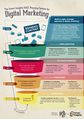 Race-digital-strategy-funnel.jpg 550 × 782; 99 KB
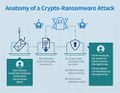 Ransomware.jpg 500 × 389; 47 KB
 Reactive Problem Management.png 642 × 351; 31 KB
 Reactor Strategy.png 851 × 221; 41 KB
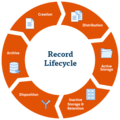 Record Lifecycle.png 600 × 600; 61 KB
 Recurrent Neural Network.png 504 × 338; 27 KB
 Regression Analysis.png 2,195 × 2,399; 255 KB
 Regression Line.png 2,308 × 2,163; 251 KB
 Reinforcement Learning.jpg 375 × 217; 12 KB
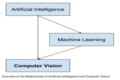 Relationship of Artificial Intelligence and Computer Vision.png 1,980 × 1,328; 281 KB
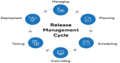 Release Management Cycle.png 1,021 × 538; 114 KB
 Resource-based Theory.jpg 400 × 302; 29 KB
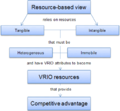 Resource-based View Model.png 409 × 377; 10 KB
 ResourceManagement.png 536 × 390; 155 KB
 Resource Allocation.png 788 × 471; 45 KB
 ResponsiveWebDesign.png 690 × 450; 333 KB
 Restricted Cone NAT.png 400 × 180; 6 KB
 Revenue.png 1,578 × 546; 89 KB
 Ring Topology.jpg 558 × 367; 22 KB
 Risk-Adjusted-Return-Jensens-Alpha.png 405 × 94; 1 KB
 Risk-Adjusted-Return-Sharpe-Ratio.png 275 × 102; 1 KB
 Risk-Adjusted-Return-Sortino-Ratio.png 278 × 93; 1 KB
 Risk-Adjusted-Return-Treynor-Ratio.png 290 × 97; 1 KB
 RiskIT.png 501 × 461; 168 KB
 RiskIT2.jpg 441 × 435; 28 KB
 RiskIT3.png 338 × 358; 108 KB
 RiskManagement.png 300 × 271; 30 KB
 RiskManagement1.png 476 × 229; 70 KB
 RiskManagement3.gif 501 × 245; 24 KB
 RiskManagement4.png 945 × 427; 399 KB
 RiskManagement5.png 932 × 527; 394 KB
 Risk Adjusted Return.png 666 × 500; 211 KB
 Risk Analysis.jpg 530 × 434; 28 KB
 Risk Assessment Methods.png 894 × 342; 199 KB
 Risk Assessment vs BIA.jpg 638 × 477; 64 KB
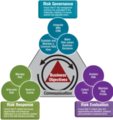
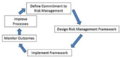
 Risk Governance Framework.png 893 × 957; 170 KB
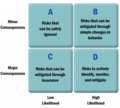
 Risk Matrix.png 600 × 463; 74 KB
 Risk Mitigation.jpg 388 × 576; 108 KB
 Risk Mitigation 1.png 1,024 × 987; 230 KB
 Rmf.JPG 491 × 261; 25 KB
 Robotic Process Automation.png 820 × 508; 95 KB
 Role of Industry.png 1,897 × 1,125; 1.69 MB
 Run-Grow-Transform.png 2,421 × 1,000; 245 KB
 Run Time Vs Compile Time.png 3,581 × 2,096; 1.29 MB
 SAM1.png 769 × 596; 448 KB
 SAMM1.png 509 × 450; 225 KB
 SAM Concept.png 2,445 × 1,754; 128 KB
 SD-WAN Architecture.png 1,103 × 669; 399 KB
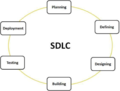 SDLC.png 883 × 673; 231 KB
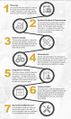 SDLC1.jpg 625 × 1,050; 179 KB
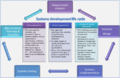 SDLC Approaches.png 700 × 456; 230 KB
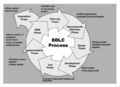 SDLC Process.png 616 × 449; 74 KB
 SEO1.jpg 797 × 400; 117 KB
 SERP.png 1,414 × 906; 642 KB
 SERP1.png 1,398 × 795; 650 KB
 SIAM.png 1,270 × 720; 758 KB
 SISP Methodologies.png 617 × 420; 77 KB
 SISP Phases.png 415 × 374; 41 KB
 SISP and IFW.png 2,183 × 1,234; 2.59 MB
 SKMS.png 600 × 381; 69 KB
 SKMS Layers.jpg 966 × 599; 106 KB
 SKMS Levels.png 1,285 × 793; 313 KB
 SLM Process.jpg 560 × 423; 63 KB
 SOA.png 987 × 658; 566 KB
 SOA1.png 685 × 172; 14 KB
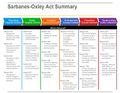 SOX Summary.jpg 632 × 491; 83 KB
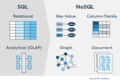 SQL Vs NoSQL.png 3,162 × 2,142; 1.35 MB
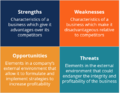 SWOT Analysis.png 768 × 592; 144 KB
 SaaS.gif 350 × 343; 19 KB
 Sales Funnel.jpg 686 × 524; 47 KB
 Samm.jpg 451 × 407; 36 KB
 Sample Call.png 794 × 408; 100 KB
 Sample Response.png 788 × 369; 88 KB
 Scheinmodel.jpg 638 × 479; 57 KB
 Scm.png 634 × 548; 160 KB
 Scm1.png 300 × 298; 45 KB
 Scope of Service Design.png 933 × 751; 310 KB
 Scrum Framework.png 959 × 673; 462 KB
 Search Engine.gif 245 × 282; 11 KB
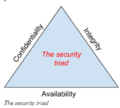 Security Triad.png 490 × 442; 61 KB
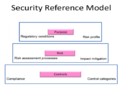 Security reference model.png 560 × 407; 117 KB
 Seo.png 350 × 282; 49 KB
 Service Catalog.png 1,274 × 870; 402 KB
 Service Design Process Flow.png 576 × 871; 234 KB
 Service Knowledge Management System.png 600 × 380; 72 KB
 Service Pipeline.png 771 × 835; 247 KB
 Service Portfolio1.png 1,305 × 738; 295 KB
 Service Portfolio Management.png 862 × 720; 183 KB
 Service Portfolio Management Process Overview.jpg 1,250 × 937; 124 KB
 Service Portfolio Management Sub Processes.jpg 560 × 467; 42 KB
 Service Quality Dimensions.png 1,137 × 929; 290 KB
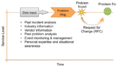
 Service Request.png 3,334 × 1,160; 327 KB
 Service operation.png 610 × 321; 76 KB
 Service operation functions.jpg 560 × 346; 18 KB
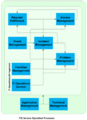 Service operation processes.png 756 × 1,044; 259 KB
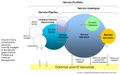 Service portfolio.jpg 1,024 × 644; 89 KB
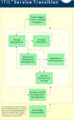
 Service transition.jpg 560 × 421; 58 KB
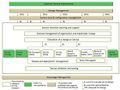
 Service transition processes.png 683 × 1,108; 602 KB
 Session Layer.png 600 × 145; 6 KB
 Seven Step CSI Process.png 887 × 677; 537 KB
 Shadow IT.png 768 × 516; 71 KB
 Shareholder Value.png 1,024 × 747; 285 KB
 Six Sigma.jpg 425 × 364; 30 KB
 Six Sigma Concept.png 679 × 915; 210 KB
 Six Thinking Hats.png 800 × 566; 254 KB
 Sixstepmethodology.png 873 × 767; 443 KB
 Soap.png 497 × 175; 17 KB
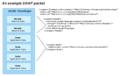 Soap Packet Example.png 2,196 × 1,391; 711 KB
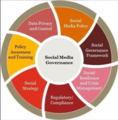 SocialMediaGov.png 294 × 300; 165 KB
 Social Engineering Attack Lifecycle.png 1,121 × 659; 268 KB
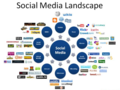 Social Media.png 600 × 450; 345 KB
 Social Media1.png 521 × 705; 217 KB
 Social Network.png 642 × 480; 78 KB
 Social Network1.jpg 484 × 397; 173 KB
 Social Network2.jpg 220 × 165; 27 KB
 Social Network3.png 858 × 858; 56 KB
 Socialnetworking.jpg 1,024 × 958; 161 KB
 Socio-technical system.png 463 × 374; 35 KB
 Software Categories.png 646 × 407; 91 KB
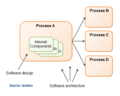
 Software Design.png 972 × 597; 380 KB
 Software architecture.png 506 × 375; 99 KB
 Software architecture1.png 939 × 525; 291 KB
 Software architecture2.png 656 × 450; 25 KB
 Software architecturesw.png 1,716 × 1,375; 582 KB
 Software project mgmt.png 462 × 313; 41 KB
 Software project mgmt1.png 585 × 508; 99 KB
 Sox Timeline.png 850 × 357; 44 KB
 Spider Diagram.jpg 1,070 × 720; 82 KB
 Spider and Bubble Map.png 1,144 × 720; 163 KB
 Squads.png 349 × 291; 35 KB
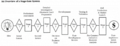
 Stage-Gate.png 819 × 381; 192 KB
 Stage-Gate Principles.jpg 600 × 441; 55 KB
 Stage-Gate Process.jpg 595 × 442; 44 KB
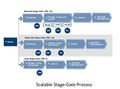
 Stage-Gate System.png 1,094 × 423; 91 KB
 Stages in Modernization Journey.png 617 × 344; 69 KB
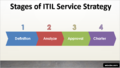 Stages of ITIL Service Strategy.png 829 × 467; 144 KB
 StaggeredBoard.png 552 × 300; 156 KB
 StaggeredBoard1.png 437 × 300; 44 KB
 Stakeholder Analysis Matrix.png 1,104 × 766; 247 KB
 Stakeholder Mapping.png 900 × 780; 107 KB
 Standard Innovation Process.png 1,095 × 301; 152 KB
 Star Model.png 1,000 × 687; 141 KB
 Star Topology.jpg 567 × 436; 28 KB
 Static NAT.jpg 353 × 115; 15 KB
 Static method.png 1,360 × 98; 13 KB
 Statistical Analysis - Graph.png 454 × 287; 7 KB
 Statistical Analysis - Line Chart.png 460 × 196; 10 KB
 Statistical Analysis - Pie Chart.png 557 × 355; 38 KB
 Statistical Analysis - Types.png 679 × 1,500; 539 KB
 Statistical Signal Processing.png 1,600 × 812; 307 KB
 Steps in Machine Learning.png 800 × 368; 214 KB
 Steps to Cybersecurity.png 1,273 × 912; 728 KB
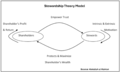 Stewardship Theory Model.png 2,922 × 1,761; 530 KB
 Story Map.png 300 × 212; 19 KB
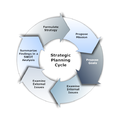 Strategic-planning-cycle.png 578 × 578; 100 KB
 Strategic Agility.jpg 960 × 350; 51 KB
 Strategic Agility Dimensions.png 688 × 277; 13 KB
 Strategic Agility Subconstructs.png 1,050 × 1,325; 1.09 MB
 Strategic Alliance.png 674 × 435; 194 KB
 Strategic Alliance1.png 622 × 540; 348 KB
 Strategic Alliance2.png 471 × 525; 172 KB
 Strategic Alliance3.png 861 × 525; 383 KB
 Strategic Business Unit.png 481 × 300; 31 KB
 Strategic Business Unit GE Model.jpg 644 × 353; 38 KB
 Strategic Business Unit Structure.jpg 545 × 311; 42 KB
 Strategic Intent.jpg 722 × 540; 54 KB
 Strategic Intent Hierarchy.jpg 638 × 479; 27 KB
 Strategic Intent Key Drivers.png 996 × 512; 393 KB
 Strategic Intent Model.png 926 × 349; 95 KB
 Strategic Management11.png 442 × 285; 66 KB
 Strategic Management13.png 326 × 285; 50 KB
 Strategic Management21.png 330 × 285; 63 KB
 Strategic Management3.png 1,315 × 262; 14 KB
 Strategic Priorities.png 300 × 221; 11 KB
 Strategic alignment1.png 434 × 450; 59 KB
 Strategic alignment2.png 632 × 450; 78 KB
 Strategic planning.png 750 × 375; 255 KB
 Strategy.png 847 × 725; 135 KB
 Strategy3.png 624 × 692; 12 KB
 Sub class extends the main class.png 1,362 × 238; 36 KB
 Succesful business models.png 432 × 313; 101 KB
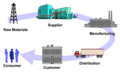 Supply-chain.png 601 × 361; 93 KB
 Supply Management Process.png 1,096 × 674; 638 KB
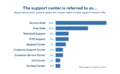 Support Center Name Survey.png 1,162 × 720; 135 KB
 Symmetric NAT.png 400 × 180; 7 KB
 Syndicated Audiences.png 1,024 × 160; 30 KB
 T-Shaped Skills.png 574 × 649; 60 KB
 TAFIM.png 699 × 314; 21 KB
 TARA Process.png 735 × 769; 218 KB
 TBM Challenges and Recommendations.png 1,055 × 410; 364 KB
 TBM Management Framework.jpg 900 × 506; 89 KB
 TBM Roadmap.png 1,297 × 788; 1.08 MB
 TBM Stakeholders.png 3,529 × 1,659; 2.98 MB
 TBM Taxonomy.png 1,020 × 562; 451 KB
 TCPIP Layers and Protocol Stack.png 2,995 × 1,196; 316 KB
 TCPIP Network Protocol Layers.jpg 1,080 × 720; 114 KB
 TDD.png 564 × 450; 101 KB
 TDD1.png 278 × 450; 79 KB
 TDD2.png 502 × 390; 62 KB
 TDD3.png 1,107 × 525; 590 KB
 TDD4.png 451 × 240; 65 KB
 TDD5.png 499 × 249; 63 KB
 TEAF Matrix.png 1,024 × 714; 61 KB
 TEI.png 757 × 504; 189 KB
 TEI1.png 852 × 365; 93 KB
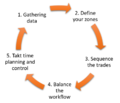 Takt Time Approach.png 768 × 660; 34 KB
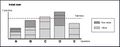
 Takt Time Balanced Line.jpg 350 × 173; 8 KB
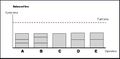
 Takt Time Initial Stage.jpg 350 × 136; 9 KB
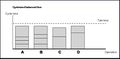 Takt Time Optimized Balanced Line.jpg 350 × 173; 9 KB
 Tco example.png 417 × 184; 4 KB
 Team org Structure.png 528 × 372; 18 KB
 Technology Assessment and Strategic Planning Process.png 3,765 × 2,231; 7.43 MB
 Tesla Business Plan.png 532 × 385; 109 KB
 Testing five.png 544 × 569; 41 KB
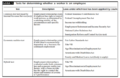 Tests determining employee status.png 647 × 422; 145 KB
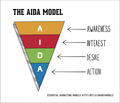 The-AIDA-model.png 600 × 513; 100 KB
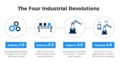 The Four Industrial Revolutions.png 1,024 × 538; 91 KB
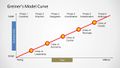 The Grenier Curve.jpg 1,279 × 720; 80 KB
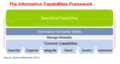 The Information Capabilities Framework.png 1,762 × 943; 414 KB
 The Spotify Model.png 2,000 × 1,346; 1.67 MB
 The Strategy Execution Process.png 320 × 222; 50 KB
 The TAFIM.png 896 × 649; 167 KB
 Theory of Planned Behavior.png 1,986 × 936; 153 KB
 Third Party Logistics1.jpg 638 × 479; 58 KB
 Third party logistics.jpg 480 × 360; 21 KB
 Threat Agent Risk Assessment.png 355 × 728; 104 KB
 Three Component Model.png 694 × 701; 267 KB
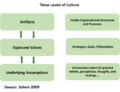 Three Levels of Culture.png 2,381 × 1,833; 63 KB
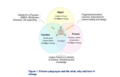
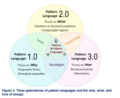
 Three generations of Pattern Language.png 2,624 × 1,846; 1.05 MB
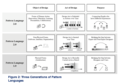
 Time based product roadmap.png 2,842 × 948; 285 KB
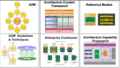 Togaf.png 797 × 450; 267 KB
 Tony Buzan Profile Mind Map.png 690 × 456; 62 KB
 Tools Driven ITOA.png 600 × 380; 102 KB
 Top Level Domain.png 792 × 396; 49 KB
 Total-Cost-of-Ownership-Model.png 831 × 647; 33 KB
 Trader Joes Culture.png 721 × 324; 73 KB
 Trajectories of Strategy.jpg 268 × 249; 14 KB
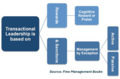 Transactional Leadership.png 1,865 × 1,221; 1.5 MB
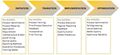
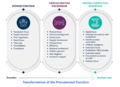 Transformation of the Procurement Function.png 1,254 × 907; 914 KB
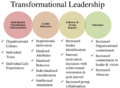 Transformational Leadership.png 902 × 665; 422 KB
 Transition Methodology.jpg 774 × 352; 62 KB
 Transport Layer.png 600 × 145; 7 KB
 Tree Topology.jpg 560 × 313; 24 KB
 Tree diagram.jpg 500 × 454; 30 KB
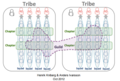
 Tribe.png 613 × 440; 136 KB
 Types Bimodal IT Organizations.png 2,087 × 1,402; 2.13 MB
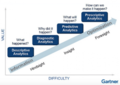 Types of Analytics.png 800 × 567; 444 KB
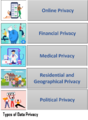 Types of Data Privacy.png 1,354 × 1,841; 847 KB
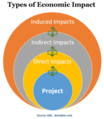 Types of Economic Impact.png 1,890 × 2,171; 2.2 MB
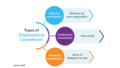 Types of Organizational Comitment.png 3,520 × 1,995; 893 KB
 Types of Service Desks.jpg 1,000 × 628; 65 KB
 Types of Strategic Goals.png 799 × 556; 156 KB
 UCE.png 867 × 264; 13 KB
 UCE1.png 432 × 461; 103 KB
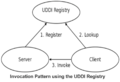 UDDI Registry.png 967 × 661; 133 KB
 UML Diagram Type.png 3,328 × 2,001; 661 KB
 Upsell-cross-sell.jpg 600 × 395; 23 KB
 Utility and warranty.png 466 × 221; 27 KB
 VMI2.png 1,200 × 617; 928 KB
 Val-IT Framework.jpg 700 × 442; 83 KB
 Val-IT Principles.jpg 675 × 251; 52 KB
 Value Chain.png 900 × 342; 252 KB
 Value Chain Analysis.jpg 736 × 465; 45 KB
 Value Chain Analysis1.png 672 × 525; 178 KB
 Value Chain Integration.png 498 × 293; 30 KB
 Value Chain extended.png 400 × 645; 88 KB
 Value Chain one or many.png 810 × 525; 68 KB
 Value Chain simple.png 848 × 448; 110 KB
 Value Risk Matrix.png 1,770 × 1,791; 168 KB
 Value Shop.png 950 × 450; 150 KB
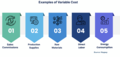 Variable Cost.png 3,520 × 1,661; 1.12 MB
 Vendor Ratings.jpg 734 × 540; 54 KB
 Vertical Organizational Structure.png 314 × 320; 49 KB
 Vertical and Horizontal Communication.png 3,160 × 1,448; 176 KB
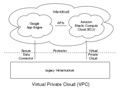 Virtual Private Cloud.png 350 × 259; 17 KB
 Virtual method overridden by abstract method.png 1,370 × 285; 45 KB
 Vocabulary of Interlinked Datasets (VoID).png 4,400 × 2,329; 2.5 MB
 WORM Write Once Read Only.png 2,374 × 1,376; 1.51 MB
 WWWFirstDraft.jpg 318 × 428; 35 KB
 Waterfall Model.png 700 × 365; 171 KB
 Waterfall Vs Agile.png 1,894 × 1,280; 199 KB
 Watermarking Techniques.png 771 × 590; 97 KB
 Web Application.gif 894 × 498; 33 KB
 Web Presence.png 760 × 400; 157 KB
 Website.png 1,600 × 798; 251 KB
 Website1.png 1,140 × 531; 542 KB
 Weisbords Six Box Model.png 787 × 497; 23 KB
 What Matters Most to Strategy Execution.gif 254 × 110; 4 KB
 Wibe.jpg 1,024 × 793; 202 KB
 Without NBAR.png 1,783 × 694; 213 KB
 Workflow.png 600 × 570; 104 KB
 Workflow Engine Components.png 2,406 × 1,142; 292 KB
 Workflow of Disciplined DevOps.png 2,683 × 2,228; 1.95 MB
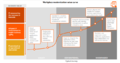 Workplace Modernization Value Curve.png 687 × 359; 109 KB
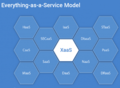 Xaas Model.png 1,025 × 748; 612 KB
 Xaas Pros and Cons.png 1,235 × 767; 499 KB
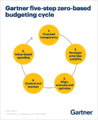 ZBB Budgeting Cycle.png 918 × 1,125; 224 KB
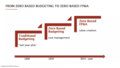 ZBB to ZBFA.png 1,875 × 1,055; 471 KB
 Zachman.jpg 582 × 450; 105 KB
 Zero-Based Budgeting.jpg 1,671 × 1,006; 292 KB


.png)


