Process Capability
Process Capability(Cp) is a measurable property of a process to the specification expressed as a process capability index (e.g., Cpk or Cpm) or as a process performance index (e.g., Ppk or Ppm). The output of this measurement is often illustrated by a histogram and calculations that predict how many parts will be produced out of specification (OOS). Two parts of process capability are 1) measure the variability of the output of a process, and 2) compare that variability with a proposed specification or product tolerance.[1]
Process Capability Index (Cpk)[2]
Process capability index (Cpk) is a statistical tool, to measure the ability of a process to produce output within a customer’s specification limits. In simple words, it measures the producer’s capability to produce a product within the customer’s tolerance range. Cpk is used to estimate how close you are to a given target and how consistent you are around your average performance. Cpk gives you the best-case scenario for the existing process. It can also estimate future process performance, assuming performance is consistent over time. Cpk is a standard index to state the capability of one process, the higher the Cpk value the better the process is. For instance, Machine 1 has a Cpk of 1.7 and machine 2 has a Cpk of 1.1. From the Cpk value, one can derive that Machine 1 is better than 2. Since Cpk uses specification limits and parts variation (sigma), we can also arrive at the yield processed and losses from the machine.
Cpk is a standard index to state the capability of one process, the higher the Cpk value the better the process is. For instance, Machine 1 has a Cpk of 1.7 and machine 2 has a Cpk of 1.1. From the Cpk value, one can derive that Machine 1 is better than 2. Since Cpk uses specification limits and parts variation (sigma), we can also arrive at the yield processed and losses from the machine.
| Cpk | Process Yield |
| 0.5 | 86.8% |
| 0.8 | 98.4% |
| 1.0 | 99.7% |
| 1.2 | 99.97% |
| 1.33 | 99.99% |
Cpk = or >1.33 indicates that the process is capable and meets specification limits. Any value less than this may mean variation is too wide compared to the specification or the process average is away from the target.
Measuring Process Capability[3]
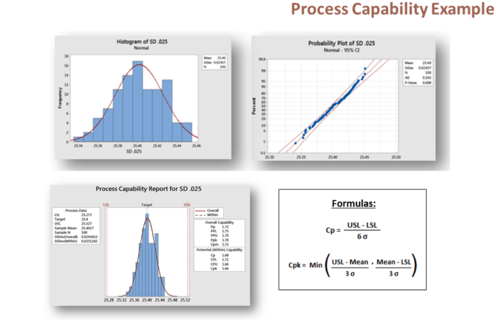
The capability indices can be calculated manually, although there are several software packages available that can complete the calculations and provide graphical data illustrating process capability. For the example in this section, we will utilize a popular statistical software package. For our example, we will utilize data from randomly collected measurements of a key characteristic of a machined part. To better represent the population values, the sample data must be randomly collected, preferably over time from a large production run. A few things to keep in mind:
- Our data is quantitative and variable
- Our data consists of 100 measurements
- The target dimension is 25.4 mm
- USL (Upper Specification Limit) = 25.527 mm
- LSL (Lower Specification Limit) = 25.273 mm
- Range = 0.254 mm
First, we will examine our data with a simple histogram to determine if it could fit a normal distribution. In addition, we can generate a probability plot evaluating our data’s best fit to a line further indicating we are 95% confident that our data fits a normal distribution.
Now let us examine the Process capability report:
- Cp (Process Capability) = 1.68
- Cpk (Process Capability Index) = 1.66
Using the graph, we can further evaluate process capability by comparing the spread or range of the product specifications to the spread of the process data, as measured by Six Sigma (process standard deviation units).
Through examination of the reports, we can determine that our example process is in a state of statistical control. All the data points fall well within the specification limits with a normal distribution. A process where almost all the measurements fall inside the specification limits is deemed a capable process. Process capability studies are valuable tools when used properly. As previously mentioned the information gained is generally used to reduce waste and improve product quality. In addition, by knowing your process capabilities, the design team can work with manufacturing to improve product quality, and processes that are “not in control” may be targeted for improvement. During a typical Kaizen event or other quality improvement initiatives, Process Capability is calculated at the start and end of the study to measure the level of improvement achieved. Accurate knowledge of process capability enables management to make decisions regarding where to apply available resources based on data.
See Also
References
- ↑ Definition - What Does Process Capability Mean? Wikipedia
- ↑ Process Capability Index (Cpk) What is Six Sigma
- ↑ How to Measure Process Capability Quality One

