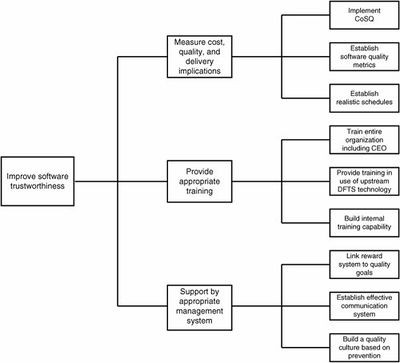
Tree Diagram
A tree diagram is a graphic tool which systematically breaks down, and then maps out in increasing detail, all components or elements of a condition, phenomenon, process, or situation, at successive levels or stages. In case of a 'divergent tree,' it begins with a single entry that has one or more paths (branches) leading out from it, some or all of which subdivide into more branches. This process is repeated until all possibilities are exhausted. In case of a 'convergent tree,' this process works in reverse. Family (genealogical) and organization charts are the common examples of a tree diagram. Also called chain of causes or dendrite diagram.[1]
This prioritization tool is especially useful for tackling complex tasks, where it is not clear exactly what is to be done, or for any job where missing a small task could result in high costs. One common use of this prioritization tool is to take a large-scale project and break it down into specific tasks that can then be assigned to specific individuals. Similarly, a tree diagram can be used to break down a project into tasks that can then be prioritized or used to compile a schedule of deadlines for the project. Tree diagrams can also be helpful in analyzing seemingly simple projects that have not been smoothly implemented in the past. By breaking the job down into its components, it becomes clear where the problematic step was omitted or mishandled.[2]
Tree Diagram Procedure[3]
1. Develop a statement of the goal, project, plan, problem or whatever is being studied. Write it at the top (for a vertical tree) or far left (for a horizontal tree) of your work surface.
2. Ask a question that will lead you to the next level of detail. For example:
- For a goal, action plan or work breakdown structure: “What tasks must be done to accomplish this?” or “How can this be accomplished?”
- For root–cause analysis: “What causes this?” or “Why does this happen?”
- For gozinto chart: “What are the components?” (Gozinto literally comes from the phrase “What goes into it?”
Brainstorm all possible answers. If an affinity diagram or relationship diagram has been done previously, ideas may be taken from there. Write each idea in a line below (for a vertical tree) or to the right of (for a horizontal tree) the first statement. Show links between the tiers with arrows.
3. Do a “necessary and sufficient” check. Are all the items at this level necessary for the one on the level above? If all the items at this level were present or accomplished, would they be sufficient for the one on the level above?
4. Each of the new idea statements now becomes the subject: a goal, objective or problem statement. For each one, ask the question again to uncover the next level of detail. Create another tier of statements and show the relationships to the previous tier of ideas with arrows. Do a “necessary and sufficient check” for each set of items.
5. Continue to turn each new idea into a subject statement and ask the question. Do not stop until you reach fundamental elements: specific actions that can be carried out, components that are not divisible, root causes.
6. Do a “necessary and sufficient” check of the entire diagram. Are all the items necessary for the objective? If all the items were present or accomplished, would they be sufficient for the objective?

source: FlyLib.com
References
- ↑ Tree Diagram Definition Business Dictionary
- ↑ When to use Tree Diagram Quality America
- ↑ Overview of Tree Diagram Asq
Further Reading
- how do you use a tree diagram to count the number of outcomes in a sample space? Virtual Nerd
