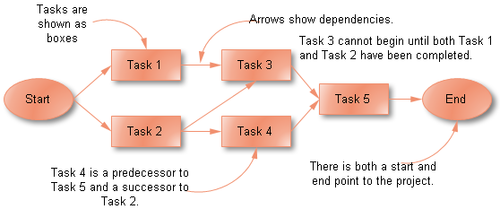
Activity Network Diagram
Business Dictionary defines Activity Network Diagram as "a quality management tool that charts the flow of activity between separate tasks.' It graphically displays interdependent relationships between groups, steps, and tasks as they all impact a project. Bubbles, boxes, and arrows are used to depict these activities and the links between them. This is also known as a flow chart, project network, or process map.[1]
The primary intent of creating an Activity Network Diagram is to create a flow chart showing the necessary tasks for a project in sequence order (including parallel and serial paths).
- Identify Critical Tasks
- Identify bottle necks
- Identify time tables.
- Determine which activities are to be performed
- Determine when activities must be performed
- Determine in what order activities must be performed[2]
An Activity Network Diagram (AND) is also called an Arrow Diagram (because the pictorial display has arrows in it) or a PERT (Program Evaluation Review Technique) Diagram, and it is used for identifying time sequences of events which are pivotal to objectives. In Critical Path Analysis this helps the teams to comprehend specific event sequences driving time requirements for objective achievement. Activity Network Diagrams are also very useful when a project has multiple activities which need simultaneous management. Activity Network Diagrams started out as an engineering and construction project management tool. Critical Path Analysis draws on this methodology to identify and standardize medical management activities.
An Activity Network Diagram helps to find out the most efficient sequence of events needed to complete any project. It enables you to create a realistic project schedule by graphically showing
- the total amount of time needed to complete the project
- the sequence in which tasks must be carried out
- which tasks can be carried out at the same time
- which are the critical tasks that you need to keep an eye on.[3]

source: Edraw
See Also
References
