IT Operations Analytics (ITOA)
What is IT Operations Analytics (ITOA)?
IT operations analytics involves collecting IT data from different sources, examining that data in a broader context, and proactively identifying problems in advance of their occurrence. With the right ITOA solution, you can detect patterns early to predict issues before they arise. You can extract insight from key operational data types, such as log files, performance metrics, events, and trouble tickets, so you can:
- Proactively avoid outages.
- Achieve faster mean time to repair (MTTR).
- Realize cost savings through greater operational efficiency.[1]
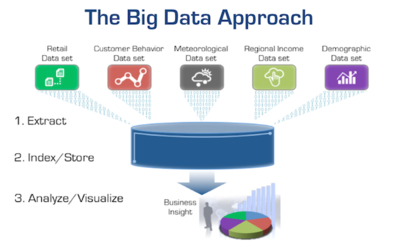
IT Operations Analytics (ITOA) is an approach that allows you to eradicate traditional data siloes using Big Data principles. By analyzing all your data via multiple sources including log, agent, and wire data, you'll be able to support proactive and data-driven operations with clear, contextualized operational intelligence:[2]
The Need to Focus on IT Operations Analytics (ITOA)[3]
There are four reasons why companies need to focus on IT Operations Analytics in today's digital age.
- Reactive to Proactive: IT Operations Analytics empowers teams to make decisions quickly, and equips them with the tools needed to make intelligent decisions. Proactive detection of patterns improves the system efficiency and helps to avoid any outages in future
- Transform Service Delivery: IT Operations Analytics benefits the end consumer with transparency and accurate service delivery, irrespective of whether the end user is a developer or a business user whose profits are proportional to system uptime.
- Enhance Capacity Planning: In the age of virtualization and Scalability, the capability to operate dynamically is mandatory and is the primary focus for infrastructure managers. ITOA computes the utilization over a period of time to arrive at the best formula or strategy to deploy resources.
- Enable BYOD Integration: The concept of Bring Your Own Device (BYOD) at work has increased the access points that need to be managed for security and sustainability. ITOA lets administrators collect and index data from applications, machines and sensors, websites, mobile devices, and more - and analyze it in real time.
ITOA Uses Big Data Principles
Nearly any Big Data initiative has the objective of transforming an organization's access to data for better and more agile business insights and actions. However, this can only be achieved through the extraction, indexing, storage, and analysis of many different data sources coupled with the flexibility to add more data sources as they become available or as opportunities arise. To provide the greatest flexibility and avoid vendor lock-in, more organizations are adopting open-source technologies like Elasticsearch, MongoDB, Spark, Cassandra, and Hadoop as their common data store. This same approach is at the heart of ITOA.
A Big Data practice provides the flexibility to combine and correlate different data sets and their sources to derive unexpected and new insights. The same objective applies to IT Operations Analytics.
The Shift from Tools-Driven to Data-Driven IT
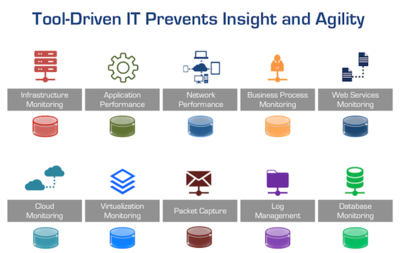
The last couple of decades has seen an accumulation of disjointed tools, resulting in islands of data that prevent you from getting a complete picture of your environment. This is the antithesis of Big Data. If the CIO wants their organization to be data-driven with the ability to provide better performance, availability, and security analysis while making more informed investment decisions, they must design a data-driven monitoring practice. This requires a shift in thinking from today's tool-centric approach to a data-driven model similar to a Big Data initiative.

Tool-centric approaches create data silos, tool bloat, and frequent cross-team dysfunction.
- If the CISO wants better security insight, monitoring, and surveillance, they must think in terms of continuous pervasive monitoring and correlated data sources, not in terms of analyzing the data silos of log management, anomaly detection, packet capture systems, or malware monitoring systems.
- If the VP of Application Development wants better cross-team collaboration, faster, more reliable, and predictable application upgrades and rollouts for both on-premises and cloud-based workloads, they must have continuous data-driven monitoring architecture and practice. The ITOA monitoring architecture must span the entire application delivery chain, not just the application stack. Because of all the workload interdependencies, without this data, an organization will be flying blind resulting in project delays, capacity issues, cross-team dysfunction, and increased costs.
- If the VP of Operations wants to cut their mean time to resolution (MTTR) in half, dramatically reduce downtime, and improve the end-user experience while instituting a continuous improvement effort, they must have the ability to unify and analyze across operational data sets.
- The CIO, security, application, network, and operations teams can achieve these objectives by drawing from the exact same data sets that are the foundation of ITOA. This effort should not be difficult, costly, or take years to implement. In fact, this new data-driven approach to IT is actually being accomplished today; we're just codifying the design principles and practices we've observed and learned from our own customers who are the inspiration behind it.
IT Operations Analytics (ITOA) Applications[4]
ITOA systems tend to be used by IT operations teams, and Gartner describes five applications of ITOA systems:
- Root Cause Analysis: The models, structures, and pattern descriptions of IT infrastructure or application stack being monitored can help users pinpoint fine-grained and previously unknown root causes of overall system behavior pathologies.
- Proactive Control of Service Performance and Availability: Predicts future system states and the impact of those states on performance.
- Problem Assignment: Determines how problems may be resolved or, at least, direct the results of inferences to the most appropriate individuals or communities in the enterprise for problem resolution.
- Service Impact Analysis: When multiple root causes are known, the analytics system's output is used to determine and rank the relative impact, so that resources can be devoted to correcting the fault in the most timely and cost-effective way possible.
- Complement Best-of-breed Technology: The models, structures, and pattern descriptions of IT infrastructure or application stack being monitored are used to correct or extend the outputs of other discovery-oriented tools to improve the fidelity of information used in operational tasks (e.g., service dependency maps, application runtime architecture topologies, network topologies).
- Real-time application behavior learning: Learns & correlates the behavior of the Application based on user patterns and underlying Infrastructure on various application patterns, creates metrics of such correlated patterns, and stores it for further analysis.
- Dynamically Baselines Threshold: Learns the behavior of Infrastructure on various application usage patterns and determines the Optimal behavior of the Infra and technological components, benchmarks, and baselines the low and high water marks for the specific environments, and dynamically changes the benchmark baselines with the changing infra and user patterns without any manual intervention
IT Operations Analytics (ITOA) Architecture[5]
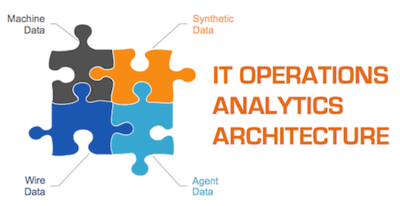
Fundamentally, there are four primary sources of intelligence and insight about your applications and infrastructure. To get a complete picture, you need some way of capturing each of these sources of IT visibility:
- Machine data (logs, WMI, SNMP, etc.) – This is information gathered by the system itself and helps IT teams identify overburdened machines, plan capacity, and perform forensic analysis of past events. New distributed log-file analysis solutions such as Splunk, Loggly, Log Insight, and Sumo Logic enable IT organizations to address a broader set of tasks with machine data, including answering business-related questions.
- Agent data (code-level instrumentation) – Code diagnostic tools including byte-code instrumentation and call-stack sampling have traditionally been the purview of Development and QA teams, helping to identify hotspots or errors in the software code. These tools are especially popular for custom-developed Java and .NET web applications. New SaaS vendors such as New Relic and AppDynamics have dramatically simplified the deployment of agent-based products.
- Synthetic data (service checks and synthetic transactions) –This data enables IT teams to test common transactions from locations around the globe or to determine if there is a failure in their network infrastructure. Although synthetic transactions are no replacement for real-user data, they can help IT teams to discover errors or outages at 2 a.m. when users have not yet logged in. Tools that fit into this category include Nimsoft, Pingdom, Gomez, and Keynote.
- Wire data (L2-L7 communications, including full bi-directional payloads) – The information available off the wire, which has traditionally included HTTP traffic analysis and packet capture, historically has been used for measuring, mapping, and forensics. However, products from vendors such as Riverbed and NetScout barely scratch the surface of what's possible with this data source. For one thing, they do not analyze the full bi-directional payload and so cannot programmatically extract, measure, or visualize anything in the transaction payload. NetFlow and other flow records—although technically machine data generated by network devices—could be considered wire data because they provide information about which systems are talking to other systems, similar to a telephone bill.
Every IT organization needs visibility into these four sources of data. Each data source serves an important purpose, although the purposes are evolving as new technologies open up new vistas in terms of what's possible. In the realm of wire data, ExtraHop unlocks the tremendous potential of this data source by making it available in real-time and in a way that makes sense for all IT teams.
IT Operations Analytics and AIOps[6]
IT Operations Analytics automates the process of collecting, identifying, and analyzing patterns, and is made even more powerful by leveraging machine learning and artificial intelligence to drastically improve service performance.
Data is the currency that guides and drives decisions and actions. Organizations need intelligent solutions that can transform data into meaningful, actionable information. The combination of ITOA and AIOps allows IT Operations Management (ITOM) teams to:
- Proactively identify issues using AI and analytics integrated directly into their ITOM tools
- Rapidly troubleshoot problems and reduce the time it takes to resolve them
- Optimize system and application performance and guide business decisions through a single analytics platform
See Also
References
- ↑ Defining IT Operations Analytics (ITOA)
- ↑ Definition - What is IT Operations Analytics (ITOA)?
- ↑ The Four Reasons for the Need to Focus on IT Operations Analytics (ITOA)
- ↑ IT Operations Analytics (ITOA) Applications
- ↑ The Four Primary Sources of Data for IT Operations Analytics (ITOA)
- ↑ Why IT Operations Analytics and AIOps?
Further Reading
- IT Operations Analytics: The driving factors that are making it 'spread like wildfire'
- Big Data & IT Operations Analytics - From Idea to Reality: Data-driven IT Operations using Big Data Principles
- Smarter IT Operations Analytics
- IT Operations analytics redefined: uncovering business impact and opportunities with Application Analytics


