Affinity Diagram
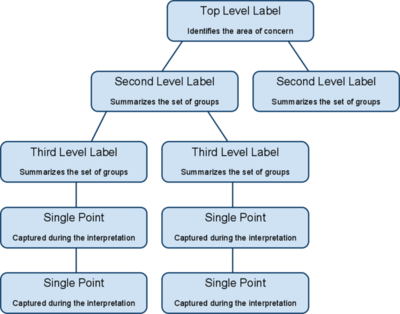
Affinity Diagram is a graphic tool designed to help organize loose, unstructured ideas generated in brainstorming or problem-solving meetings. In this method, disparate but related ideas (collected in an idea generation session) are grouped (on cards or sheets of paper) into meaningful categories called affinity sets. These categories tie different concepts together with one underlying theme, clarify the issues, and provide a structure for a systematic search for one or more solutions. Known also as KJ Method after its inventor, the Japanese anthropologist Jiro Kawakita (born 1920). Also called affinity chart.[1]
Affinity Diagram Procedure[2]
- Materials needed: sticky notes or cards, marking pens, large work surface (wall, table, or floor).
Record each idea with a marking pen on a separate sticky note or card. (During a brainstorming session, write directly onto sticky notes or cards if you suspect you will be following the brainstorm with an affinity diagram.) Randomly spread notes on a large work surface so all notes are visible to everyone. The entire team gathers around the notes and participates in the next steps.
- It is very important that no one talk during this step. Look for ideas that seem to be related in some way. Place them side by side. Repeat until all notes are grouped. It’s okay to have “loners” that don’t seem to fit a group. It’s all right to move a note someone else has already moved. If a note seems to belong in two groups, make a second note.
- You can talk now. Participants can discuss the shape of the chart, any surprising patterns, and especially reasons for moving controversial notes. A few more changes may be made. When ideas are grouped, select a heading for each group. Look for a note in each grouping that captures the meaning of the group. Place it at the top of the group. If there is no such note, write one. Often it is useful to write or highlight this note in a different color.
- Combine groups into “supergroups” if appropriate.

source: [1]
= See Also
- Brainstorming: Brainstorming is a creative problem-solving technique that involves generating many ideas or solutions in a free-flowing and non-judgmental manner. The affinity diagram is often used as a follow-up activity to brainstorming sessions to organize and group the generated ideas into meaningful categories.
- Grouping and categorization: Affinity diagrams facilitate the grouping and categorizing of related ideas, concepts, or information. They visually represent how individual items or ideas can be organized into clusters based on their similarities or relationships, enabling a deeper understanding and analysis of the collected data.
- Visual thinking: Affinity diagrams leverage visual thinking, which is the process of using visual representations to understand, organize, and communicate information effectively. By visually grouping related ideas or concepts, affinity diagrams provide a clear and concise representation of complex or diverse information, making it easier for individuals or teams to grasp patterns and make connections.
- Root Cause Analysis: Affinity diagrams can be used in root cause analysis, a problem-solving technique to identify the underlying causes of issues or problems. By organizing and categorizing potential causes, an affinity diagram helps teams analyze and prioritize the root causes and develop targeted solutions.
- Decision Making: Affinity diagrams can support decision-making processes by providing a structured framework for considering different perspectives, viewpoints, or options. They enable teams to analyze and evaluate the pros and cons of various categories or groups, aiding in selecting the most suitable course of action.
References
- ↑ What is Affinity Diagram? Business Directory
- ↑ Affinity Diagram Procedure ASQ
Further Reading
- Using Affinity Diagrams to make sense from Brainstorming LeanYourCompany
- An Affinity for Organized Thinking: A Diagram With Many Uses Isixsigma
- How to Create an Affinity Diagram LSS
