Expected Return
Business Dictionary defines Expected Return as "the process of determining the average expected probability of various different rates of return that are possible on a given asset. Factors in this determination include different market conditions as well as an asset's beta.'[1]
Expected Return Formula
How to Calculate Expected Return[2]
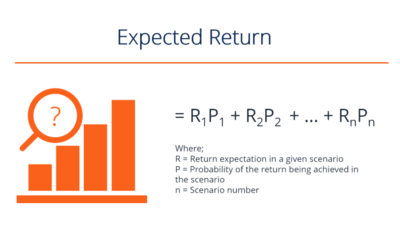
The return on the investment is an unknown variable that has different values associated with different probabilities. Expected return is calculated by multiplying potential outcomes (returns) by the chances of each outcome occurring, and then calculating the sum of those results (as shown below).

source: Corporate Finance Institute
In the short term, the return on an investment can be considered a random variable that can take any values within a given range, with some distinct probabilities. The expected return is based on historical data, which may or may not provide reliable forecasting of future returns. Hence, the outcome is not guaranteed. Expected return is simply a measure of probabilities intended to show the likelihood that a given investment will, on average, generate a positive return, and what the likely return will be.
The purpose of calculating the expected return on an investment is to provide an investor with an idea of the probable return on an investment that carries some level of risk, such as a stock or mutual fund. This gives the investor a basis for comparison with the risk-free rate of return, as well as with the eventual actual return that the investor receives. The interest rate on 3-month U.S. Treasury bills is often used to represent the risk-free rate of return.
Limitations of the Expected Return
The Drawbacks of Expected Return[3]
It is quite dangerous to make investment decisions based on expected returns alone. Before making any buying decisions, investors should always review the risk characteristics of investment opportunities to determine if the investments align with their portfolio goals. For example, assume two hypothetical investments exist. Their annual performance results for the last five years are:
Investment A: 12%, 2%, 25%, -9%, 10% Investment B: 7%, 6%, 9%, 12%, 6%
Both of these investments have expected returns of exactly 8%. However, when analyzing the risk of each, as defined by the standard deviation, Investment A is approximately five times riskier than Investment B (Investment A has a standard deviation of 12.6% and Investment B has a standard deviation of 2.6%).
See Also
Return on Investment (ROI)
Return on Invested Capital (ROIC)
Return on Equity (ROE)
Return on Capital (ROC)
Return on Assets (ROA)
Return on Capital Employed (ROCE)
Return on Net Assets (RONA)
Earnings Per Share (EPS)
Shareholder Value
Shareholder Theory
Shareholder Value Perspective
Shareholders' Equity
References
- ↑ Definition: What is Expected Return? Business Dictionary
- ↑ How to Calculate Expected Return? CFI
- ↑ What are the limitations of Expected Return? Invetopedia
Further Reading
- What is the Expected Return on a Stock? Ian Martin Christian Wagner
- Estimating Expected Returns Thomas K. Philips
- Expectations of Returns and Expected Returns Robin Greenwood and Andrei Shleifer
