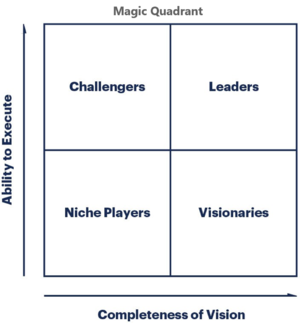
Gartner Magic Quadrant
Gartner Magic Quadrant offers visual snapshots, in-depth analyses and actionable advice that provide insight into a market’s direction, maturity and participants. Magic Quadrants compare vendors based on Gartner’s standard criteria and methodology. Each report comes with a Magic Quadrant graphic that depicts a market using a two-dimensional matrix that evaluates vendors based on their Completeness of Vision and Ability to Execute. Gartner Magic Quadrant research methodology provides a graphical competitive positioning of four types of technology providers in fast-growing markets: Leaders, Visionaries, Niche Players and Challengers.[1]
The term “Magic Quadrant” was first used in public by Gartner in 1994 but its history goes back to the 1980s when it was meant as a quick overview to a market segment. The Magic Quadrant had its inception at research meetings conducted by Gideon Gartner when Gartner Group was still small enough for most of the analysts to fit in one room at 50 Topgallant Road in Stamford, Connecticut. Gideon was a proponent of "Stalking Horses" thought experiments that would spark innovative thinking. During one meeting an analyst was presenting on a new technology sector. Gideon stepped to the easel and drew a quadrant with two axis bisecting it. He never meant Quadrants to be published and they never were on his watch. Sometime in the 90s the Quadrant evolved into an official Research Note and today there are hundreds of Magic Quadrants for sectors as defined as Firewalls and as obscure as Cloud Infrastructure as a Service and Web Hosting.
The Magic Quadrant has two axes. The horizontal is "Completeness of Vision" and is a reflection of how many features a product has and the innovative enhancements that are forcing other vendors to react to keep pace. The vertical axis is "Ability to Execute" and is determined by revenue, number and quality of resellers and distributors, number of employees and their distribution between engineering, sales, and support and other business issues. Thus, the upper right quadrant is were the Leaders sit, the lower right is Visionaries, the lower left is Niche, and the upper left is Challengers.[2]
Gartner uses the Magic Quadrants as a way to position technology players within a specific market. It uses a proprietary research methodology, so it’s not clearly spelled out how vendors end up where they are. (Gartner has been subject to a fair share of criticism for the lack of transparency in their research). Basically, the report places vendors in a one of 4 quadrants: ‘Leaders’, ‘Challengers’, ‘Visionaries’ and ‘Niche Players’ based on their “Completeness of Vision” (x-axis) rated against 8 evaluation criteria and their “Ability to Execute” (Y-axis) rated against 7 evaluation criteria.[3]
Entries are assessed after an extensive data-gathering process, in which vendors are obliged to respond to an in-depth technical RFI document, and over 20 customers of the vendor fill out a lengthy online survey. All this research is used to inform the opinion of analysts, who then place vendors on the chart depending on their consideration of its completeness of the solution and ability to execute. The chart is segmented into four quadrants which divide the companies listed into four broad categories, identifying them as niche, challenger, visionary, or leader. Gartner advises users to take notice of all quadrants, since businesses in every category have their own unique strengths and weaknesses. The firm says that Magic Quadrant reports are designed to help narrow down a vendor search, not tell a customer which vendor they should choose but by this argument, if a vendor is not on the Magic Quadrant graphic, it will not form part of the decision process.[4]
Magic Quadrant has been criticized for its simplicity, subjectivity and blind spots. It has been pointed out that the criteria for the Magic Quadrant cater more towards investors and large vendors than towards buyers. Much of the criticism is focused on the lack of disclosure of the money received from the vendors it rates, raising conflict of interest issues. Also a source of criticism is the lack of disclosure on the vendor's component scores and the lack of transparency in Gartner's methodology used to derive the vendor's position on the MQ map.
The Magic Quadrant, and analysts in general, also skew the market: according to research, by applying their methodologies to describe a market, they change that marketplace to fit their tools.
Another criticism is that open source vendors are not considered sufficiently by analysts like Gartner, as has been published in an online discussion between a VP from Talend and a German Research VP from Gartner.
Gartner was the target of a federal lawsuit (filed May 29, 2009) from software vendor, ZL Technologies, challenging the “legitimacy” of Gartner’s Magic Quadrant rating system. Gartner filed a motion to dismiss by claiming First Amendment protection since it contends that its MQ reports contain "pure opinion", which legally means opinions which are not based on fact. The court threw out the ZL case because it lacked a specific complaint. That decision was upheld on appeal.[5]
See Also
Gartner's Hype Cycle Methodology
Gartner's PACE Layered Application Strategy
Gartner Business Value Model
Gartner Magic Quadrant
Gartner's MarketScopes
Gartner Vendor Rating
Gartner Market Forecast
Gartner's Market Share Analysis

